The logarithmic function $latex y=\log _ {b} x$ is defined as the inverse function of the exponential function $latex y={{b}^x}$. Knowing this, we can graph logarithmic functions by looking at the relationship between logarithmic functions and exponential functions.
We will look at several graphs of logarithmic functions that have horizontal and vertical translations.
- Terminology of exponential functions
- How to obtain graphs of logarithmic functions?
- Graphs of basic logarithmic functions
- Graphs of logarithmic functions with horizontal displacement
- Graphs of logarithmic functions with vertical displacement
- Graphs of logarithmic functions with horizontal and vertical displacement
- See also
Terminology of exponential functions
Before starting with the graphs of logarithmic functions, it is important that we familiarize ourselves with some terms that will be used.
Domain of a function
The domain of a function is the set of values that we can substitute in the function to obtain real values of y. That is, the domain is all possible values for x.
Range of a function
The range is the set of values that we obtain by using the values of the domain of the function.
Asymptotes
An asymptote is a line that a curve approaches as the x or y values tend to infinity. We have three types of asymptotes: vertical, horizontal, and slanted.
The vertical asymptote is the value of x by which the function grows without limits when it is close to that value.
The horizontal asymptote is a value of y that the function approaches as the values of x grow without limits.
Slanted asymptotes are linear equations that the function approaches as the values of x tend to infinity.
How to obtain graphs of logarithmic functions?
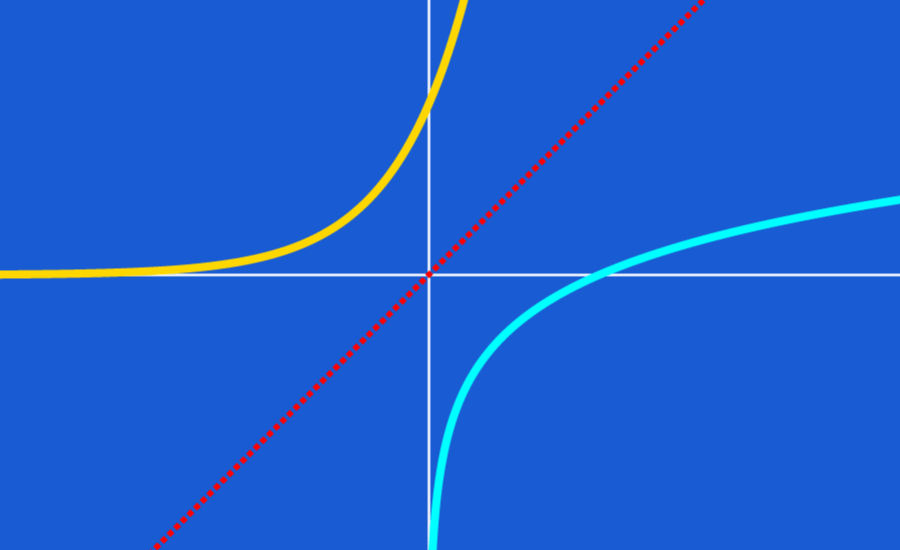
We can graph a logarithmic function by examining the graph of an exponential function and then swapping the values of x and y.
The graph of an exponential function $latex y={{b}^x}$ has the following characteristics:
- The domain of an exponential function is all real numbers. That is, the values of x range from negative infinity to positive infinity.
- The range is all real positive numbers. That is, from 0 to positive infinity.
- The graph of an exponential function generally passes through the point (0, 1), which means that this point is the y-intercept.
- The graph of an exponential function $latex y={{b}^x}$ has a horizontal asymptote at $latex y=0$.
- If we have $latex 1>b>0$, the function decreases from left to right and is called exponential decay.
- If we have $latex b>1$, the graph increases from left to right and is called exponential growth.
Using each of the mentioned characteristics, we can deduce equivalent characteristics for the logarithmic functions:
- The domain of a logarithmic function is all positive real numbers, from 0 to positive infinity.
- The range of an exponential function is all real numbers.
- The graph of a logarithmic function passes through the point (1, 0).
- The graph of a logarithmic function has a vertical asymptote at $latex x=0$.
- If we have $latex 1>b>0$, the graph will decrease from left to right.
- If we have $latex b>1$, the graph will grow from left to right.
Graphs of basic logarithmic functions
We can consider a basic logarithmic function as a function that has no horizontal or vertical displacements.
We can graph basic logarithmic functions by following these steps:
Step 1: All basic logarithmic functions pass through the point (1, 0), so we start by graphing that point.
Step 2: We know that the graph has an asymptote at $latex x = 0$, so we plot it.
Step 3: If the base of the function is greater than 1, the graph increases from left to right. If the base of the function is between 0 and 1, the graph decreases from left to right.
EXAMPLE 1
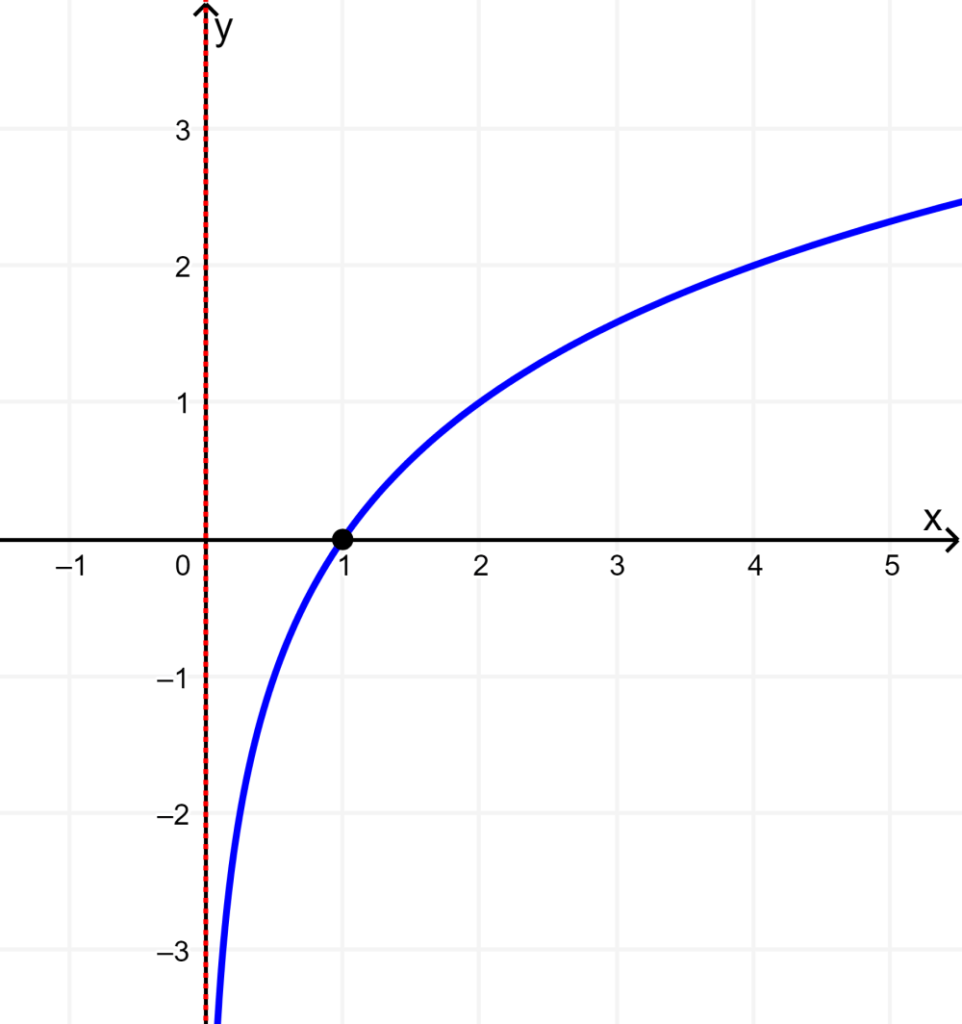
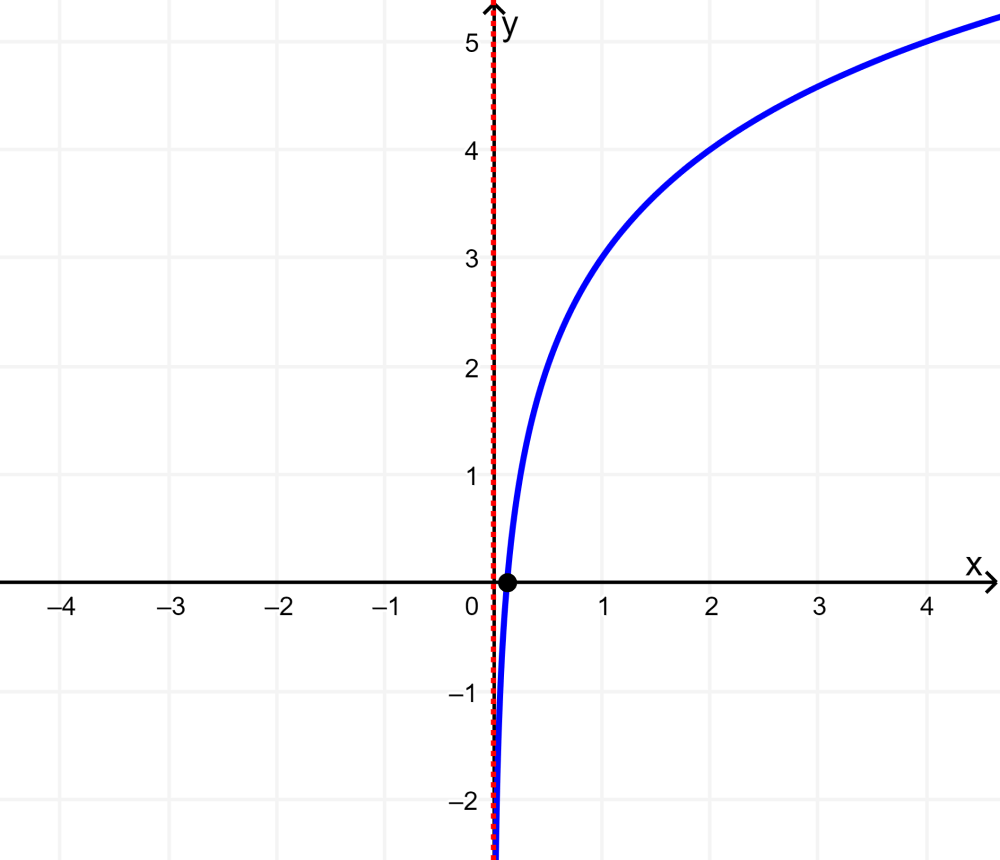
Graph the logarithmic function $latex y=\log_ {2} x$.
Solution: We start by plotting the point (1, 0). We know that the logarithmic function must have the domain of (0, infinity) and the range of (-infinite, infinity).
Since the logarithmic function $latex y=\log_{2}x$ has a base that is greater than 1, we increment the curve from left to right as shown below.
The horizontal asymptote cannot be displayed since it is located exactly on the y-axis.
EXAMPLE 2
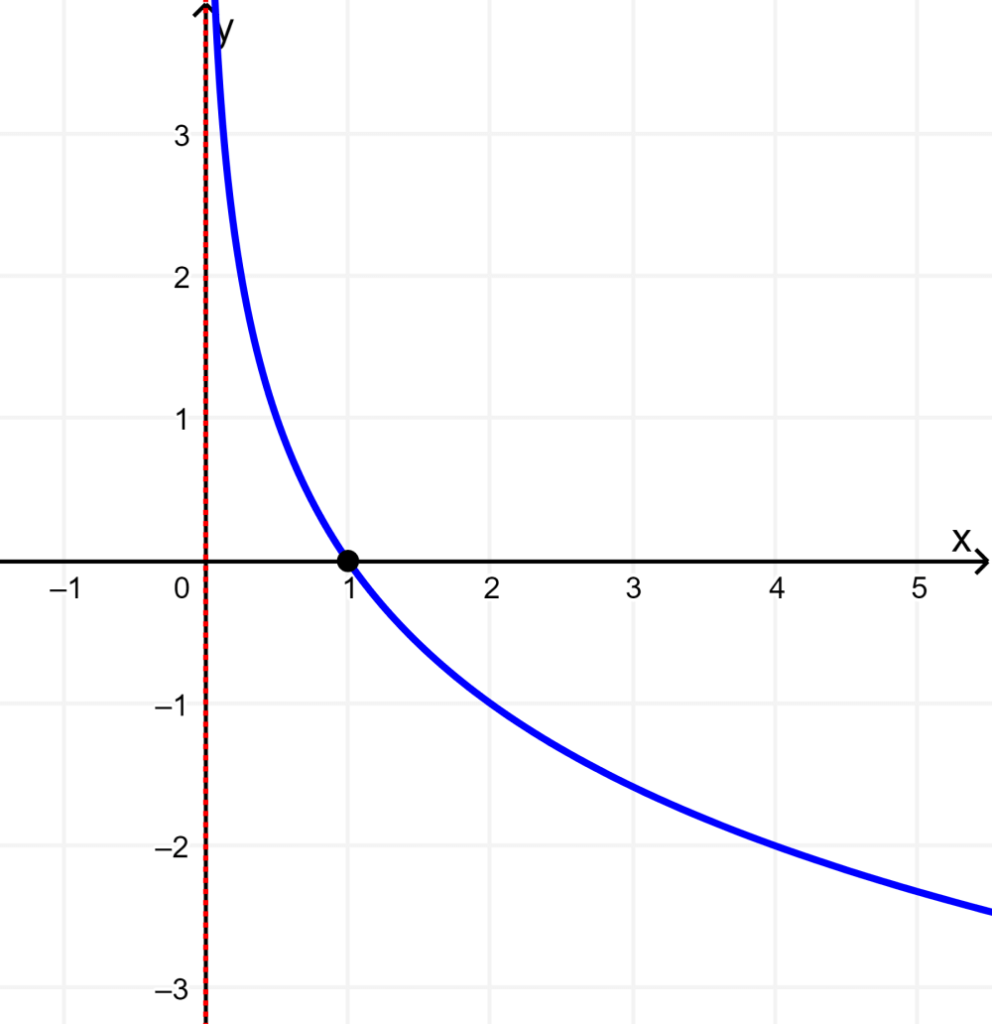
Graph the logarithmic function $latex y=\log_ {0.5}x$.
Solution: Similarly, we plot the point (1, 0). The function has the same domain and range as the previous one. The domain is (0, infinity) and the range is (-infinite, infinity).
The vertical asymptote is located exactly on the y-axis.
In this case, the base of the function $latex y=\ log_{0.5}x$ is less than 1, but greater than 0, so the function decreases from left to right.
Graphs of logarithmic functions with horizontal displacement
Logarithmic functions with horizontal displacement have the form $latex y=\log_{b} (x-h)$, where h is the horizontal displacement. By applying a horizontal displacement, we produce the following changes in the graphs:
- The x-intercept moves to the right or left by a distance that corresponds to the value of h.
- The vertical asymptote moves the same distance.
- The domain of the function is also affected.
EXAMPLE 1
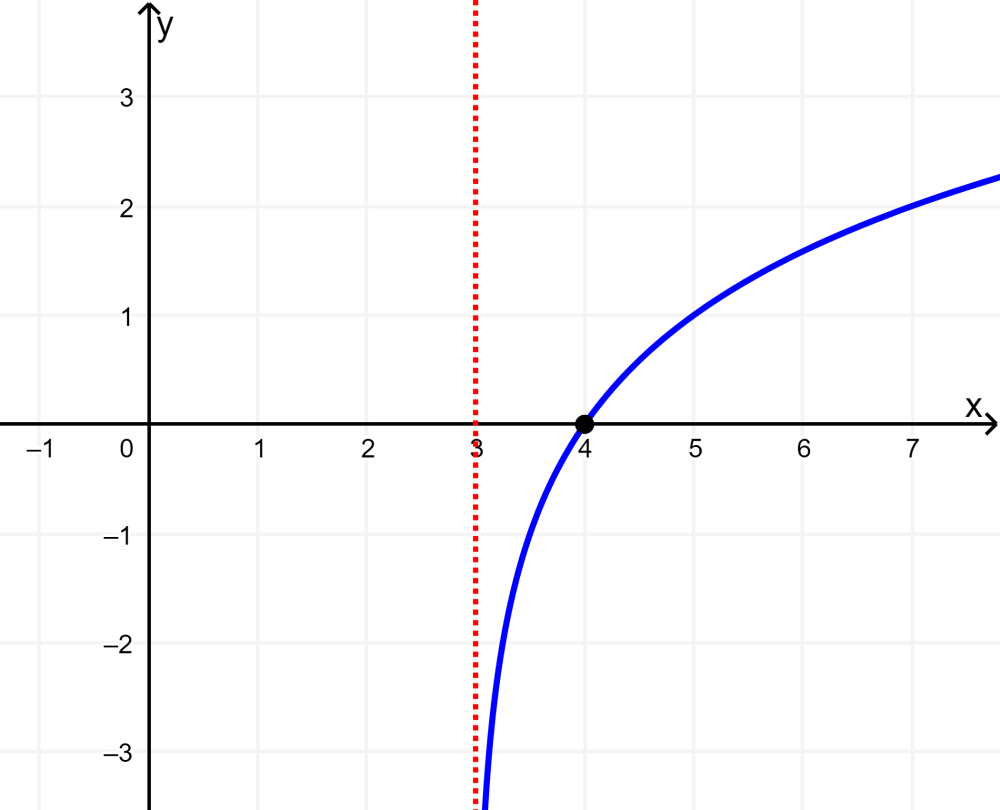
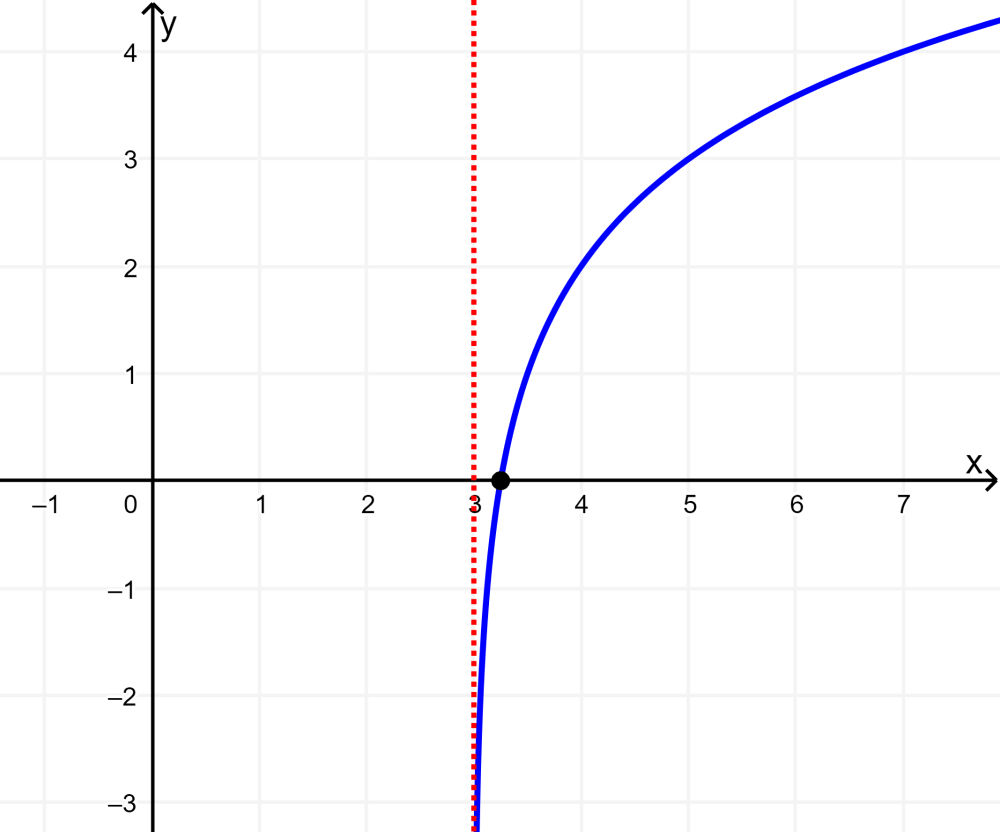
Graph the logarithmic function $latex y=\log_{2}(x-3)$.
Solution: The x-intercept is located at (4, 0). The function has the domain (3, infinity) and the range is (-infinite, infinity).
The vertical asymptote is located at $latex x=3$.
The base of the function is greater than 1, so the function grows from left to right.
EXAMPLE 2
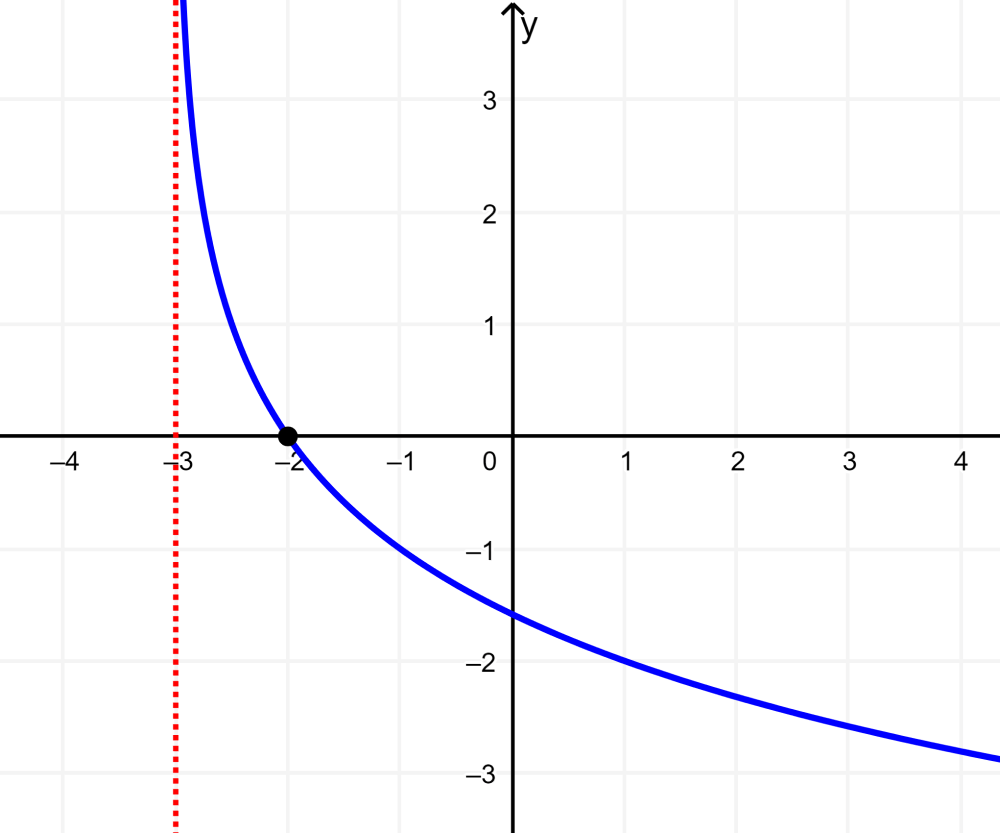
Graph the logarithmic function $latex y=\log _{0.5}(x+3)$.
Solution: The x-intercept is located at (-2, 0). The function has the domain (-3, infinity) and the range is (-infinite, infinity).
The vertical asymptote is located at $latex x=-3$.
In this case, the base of the function $latex y=\log_{0.5}x$ is less than 1, but greater than 0, so the function decreases from left to right.
Graphs of logarithmic functions with vertical displacement
A logarithmic function with vertical displacement has the form $latex y=\ log_{b}(x)+k$, where k is the vertical displacement. With a vertical displacement in the graph, we produce the following:
- The x-intercept moves up or down by a distance of k.
EXAMPLE
Graph the logarithmic function $latex y=\log_{2}(x)+3$.
Solution: The logarithmic function has the domain (0, infinity) and the range is (-infinite, infinity).
The vertical asymptote is located at $latex x=0$.
The function grows from left to right since its base is greater than 1.
Graphs of logarithmic functions with horizontal and vertical displacement
A logarithmic function with horizontal and vertical displacement has the form $latex y=\log_{b}(x-h)+k$, where h is the horizontal displacement and k is the vertical displacement.
EXAMPLE 1
Graph the logarithmic function $latex y=\log_{2}(x-3)+2$.
Solution: The graph is displaced 3 units to the right and 2 units up. The function has the domain (3, infinity) and the range is (-infinite, infinity).
The vertical asymptote is located at $latex x=3$.
The base of the function is greater than 1, so the function grows from left to right.
EXAMPLE 2
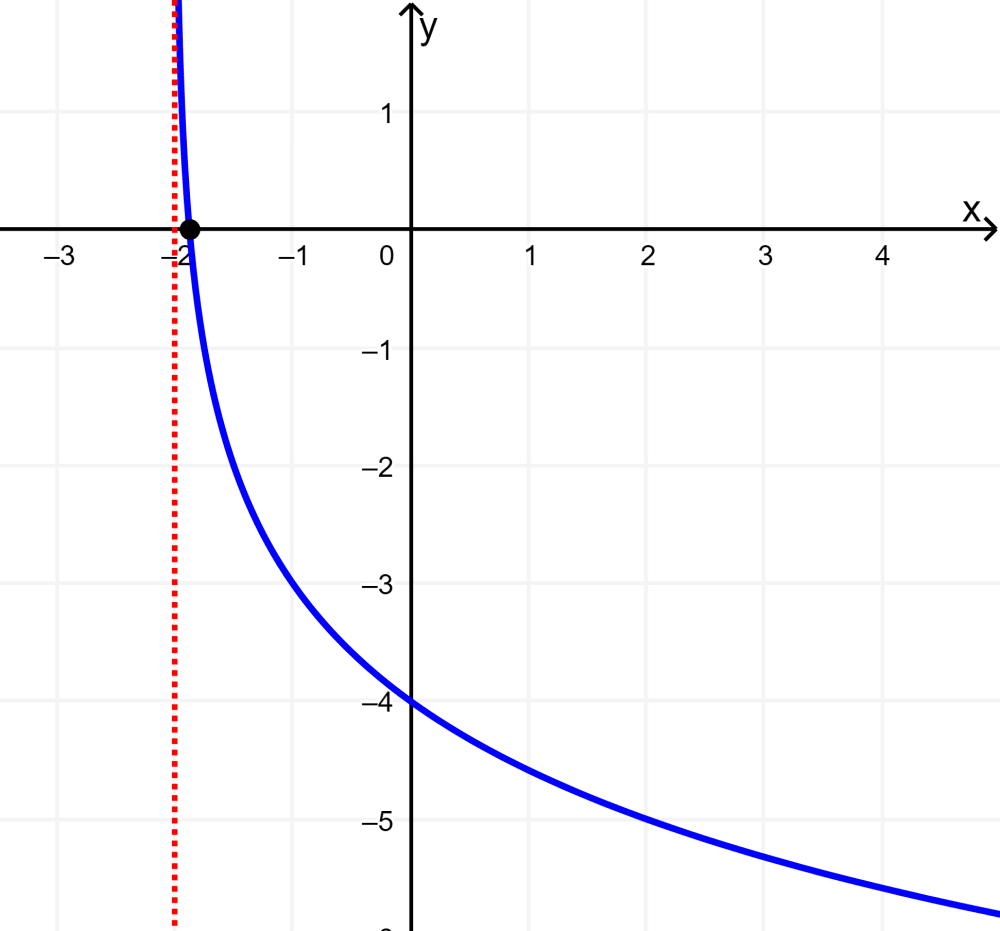
Graph the logarithmic function $latex y=\log_{0.5}(x+2)-3$.
Solution: The original function is displaced 2 units to the left and 3 units down.
The vertical asymptote is located at $latex x=-2$.
In the function $latex y=\log_{0.5}x$, the base is less than 1 and greater than 0, so the function decreases from left to right.
See also
Interested in learning more about graphs of functions? Take a look at these pages:

Jefferson Huera Guzman
Jefferson is the lead author and administrator of Neurochispas.com. The interactive Mathematics and Physics content that I have created has helped many students.