There are three basic methods for graphing linear functions. The first method is to plot points and then draw a line to connect the points. The second method is to use the y-intercept and the slope. The third method is to apply transformations to the function $latex f(x) = x$.
Here, we will learn how to graph linear functions using the three methods mentioned. In addition, we look at some examples to practice the methods.
Graphs of linear functions using points
We can use different input values and evaluate the function with those values to get different Cartesian coordinates. Then, we plot these points on a grid. We have to evaluate the function with at least two different input values to obtain at least two different points to be able to graph the function.
For example, if we have the function $latex f(x)=x+2$, we can use the input values 1 and 2. By evaluating the function with the input value 1, we obtain the output value 3, which forms the point with Cartesian coordinates (1, 3). Using the input value 2, we obtain the output value 4, forming the point with coordinates (2, 4).
To avoid making mistakes, we can use three points. Thus, if the line does not pass through the three points, we know that we made a mistake.
How to graph a linear function using points?
Step 1: Choose a minimum of two input values.
Step 2: Evaluate the function at each input value.
Step 3: Use the resulting output values to form Cartesian coordinates.
Step 4: Graph the Cartesian coordinates on a grid.
Step 5: Draw a line through the points.
EXAMPLE 1
Graph the function $latex f(x)=2x-3$ using points.
Solution: We start by choosing the input values. We are going to choose three different values. We will choose the -2, 0, and 2.
Evaluate the function at each input value and use the output value to form the Cartesian coordinates for the points :
$latex x=-2$ $latex f(-2)=2(-2)-3=-7$ ⇒$latex (-2, -7)$
$latex x=0$ $latex f(0)=2(0)-3=-3$ ⇒$latex (0, -3)$
$latex x=2$ $latex f(2)=2(2)-3=1$ ⇒$latex (2, 1)$
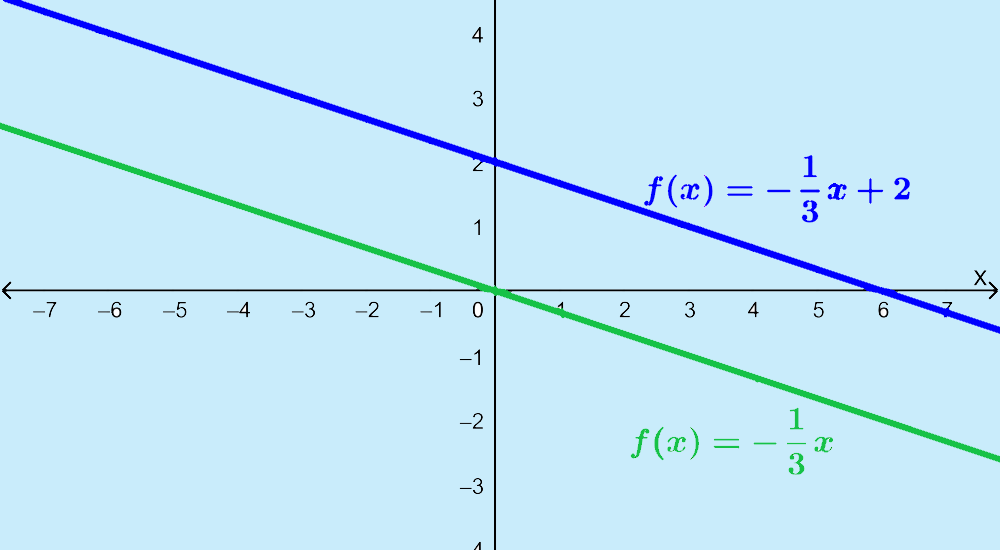
We graph the points and draw a line that passes through those points. The following is the graph of $latex f(x)=2x-3$:
We can see that as we expected, the graph of the function is a straight line. This line grows from left to right, indicating a positive slope.
EXAMPLE 2
Graph the function $latex f(x)=-\frac{1}{3}x+4$ using points.
Solution: We start by choosing the input values. Now we have a fraction, so we can choose multiples of 3 or 0 to make the problem easier. We are going to choose three different numbers. We will choose the -3, 0, and 3.
We use each of the input values to obtain output values and form the Cartesian coordinates for the points:
$latex x=-3$ $latex f(-3)=-\frac{1}{3}(-3)+4=5$ ⇒$latex (-3, 5)$
$latex x=0$ $latex f(0)=-\frac{1}{3}(0)+4=4$ ⇒$latex (0, 4)$
$latex x=3$ $latex f(3)=-\frac{1}{3}(3)+4=3$ ⇒$latex (3, 3)$
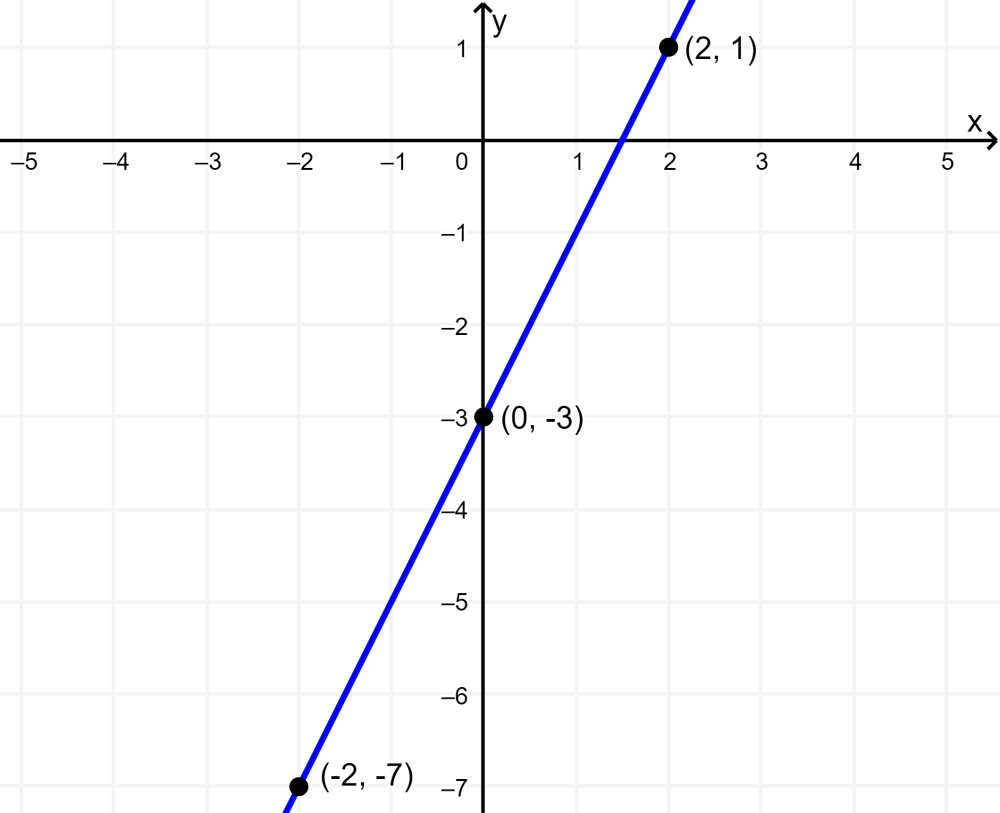
We place those points on the Cartesian plane and draw a line that passes through those points. The following is the graph of $latex f(x)=-\frac{1}{3}x+4$:
Again, we see that the graph of the function is a straight line. This line decreases from left to right indicating a negative slope.
Graphs of linear functions using the slope and y-intercept
Instead of using points, another way to graph linear functions is by using the main characteristics of linear functions. The first characteristic is the y-intercept, which is the point when the value of x is 0. To find the y-intercept, we simply use the value $latex x = 0$ as the input in the function.
The second characteristic of linear functions is the slope, m, which is a measure of the steepness of the line. The slope in a linear function is equal to the rate of change in the output values over the rate of change of the input values. That is, the slope is the change in the values of y over the change in the values of x.
We need to find the slope and the y-intercept of the linear functions. We are going to use these characteristics to graph these functions. Let’s look at the following function:
$latex f(x) = 2x-5$
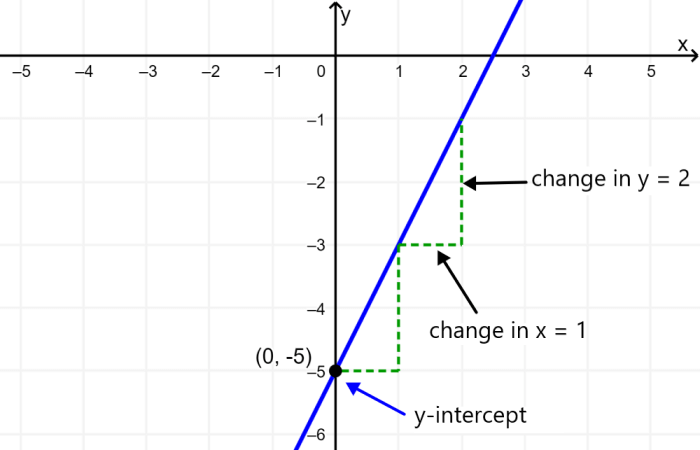
The slope is 2. Since the slope is positive, we know that the line will grow from left to right. The y-intercept is the point on the graph when $latex x = 0$. So the graph crosses the y-axis at the point (0, -5).
Now that we know the slope and the y-intercept, we can start by plotting the point (0, -5). We know that the slope represents the change in y over the change in x. Here we have $latex m= 2$, which means that the change in y is 2 and the change in x is 1.
Starting from the point (0, -5), we can advance 1 in x and 2 in y. We repeat until we have several points and draw a line.
How to graph linear functions using slope and y-intercept?
Step 1: Evaluate the function with $latex x = 0$ to find the y-intercept.
Step 2: Identify the slope.
Step 3: Graph the point that represents the y-intercept.
Step 4: Identify more points on the line using the change in y over the change in x.
Step 5: Draw the line that passes through the points.
EXAMPLE 1
Graph the function $latex f(x)=3x-3$ using the slope and the y-intercept.
Solution: Evaluate the function at the point $latex x=0$ to find the y-intercept. The value of the function when $latex x = 0$ is -3, so the graph crosses the y-axis at the point (0, -3).
The slope of the line is 3. This tells us that every time we move 1 unit on the x-axis, we move 3 units on the y-axis. After marking several points, we draw a line through those points:
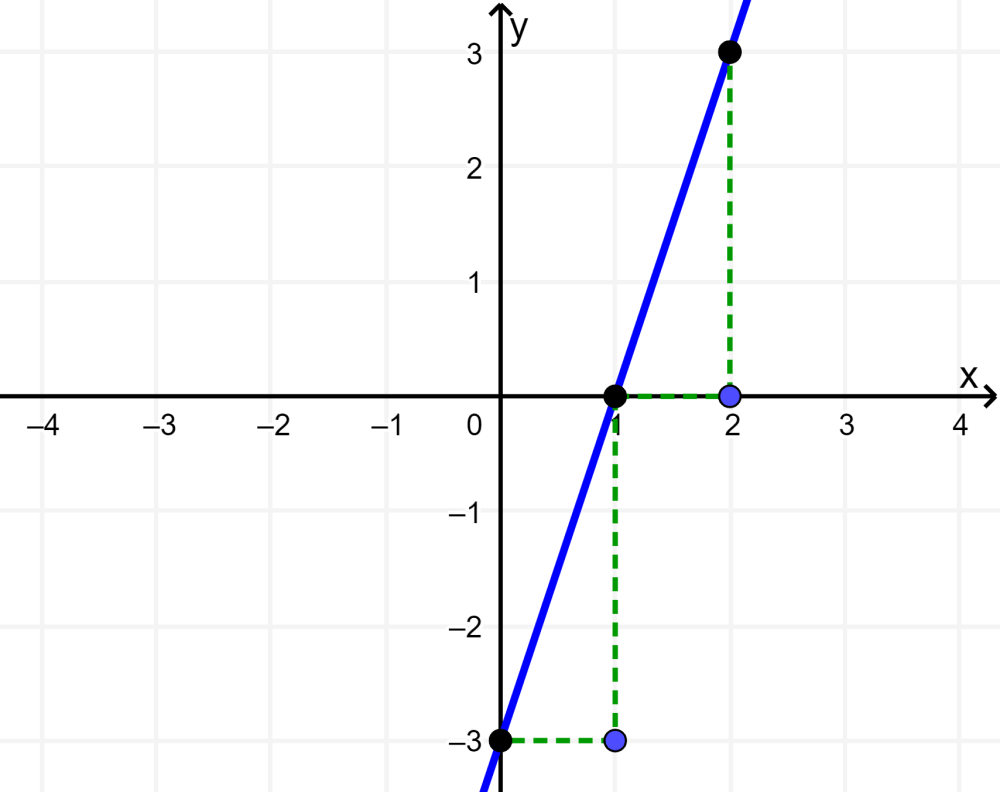
We can see that the graph increases from left to right, so it has a positive slope as expected.
EXAMPLE 2
Graph the function $latex f(x)=-\frac{1}{2}x+5$ using the slope and the y-intercept.
Solution: We evaluate the function at the point $latex x = 0$ to find the y-intercept. When we have $latex x = 0$, the value of the function is 5, so the point of intersection is (0, -3).
We see that the slope of the line is $latex -\frac{1}{2}$. This means that every time we move 2 units on the x-axis, we move -1 units on the y-axis. We mark several points and draw a line that crosses those points:
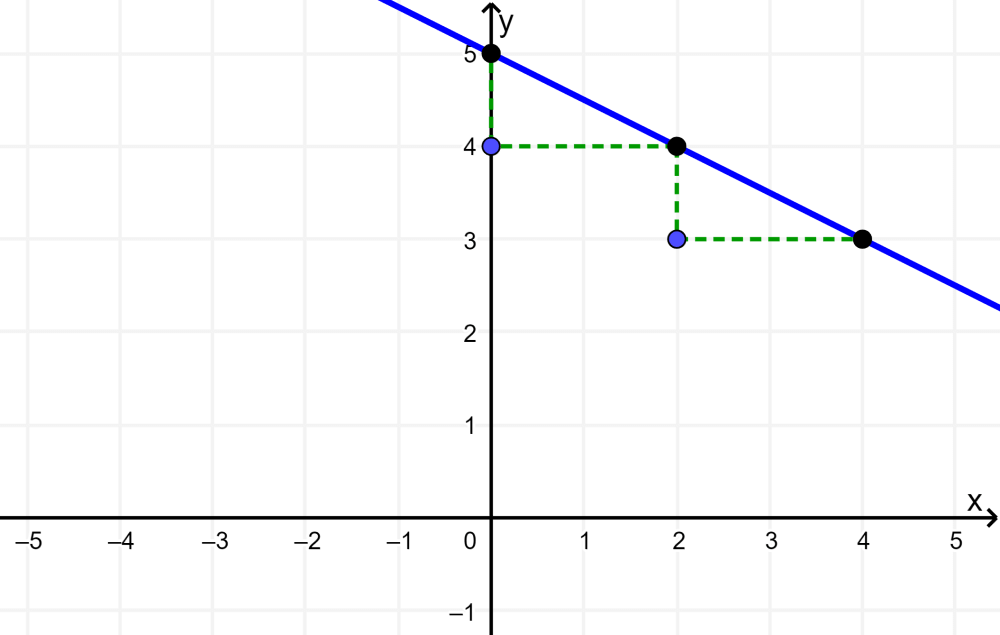
This time, the graph decreases from left to right, which means that the slope is negative.
Graphs of linear functions using transformations
Another way to graph functions is by using transformations on the identity function $latex f(x)=x$. A function can be transformed by translating it up, down, left, or right. We can also transform a function by stretching, shrinking, or mirroring it.
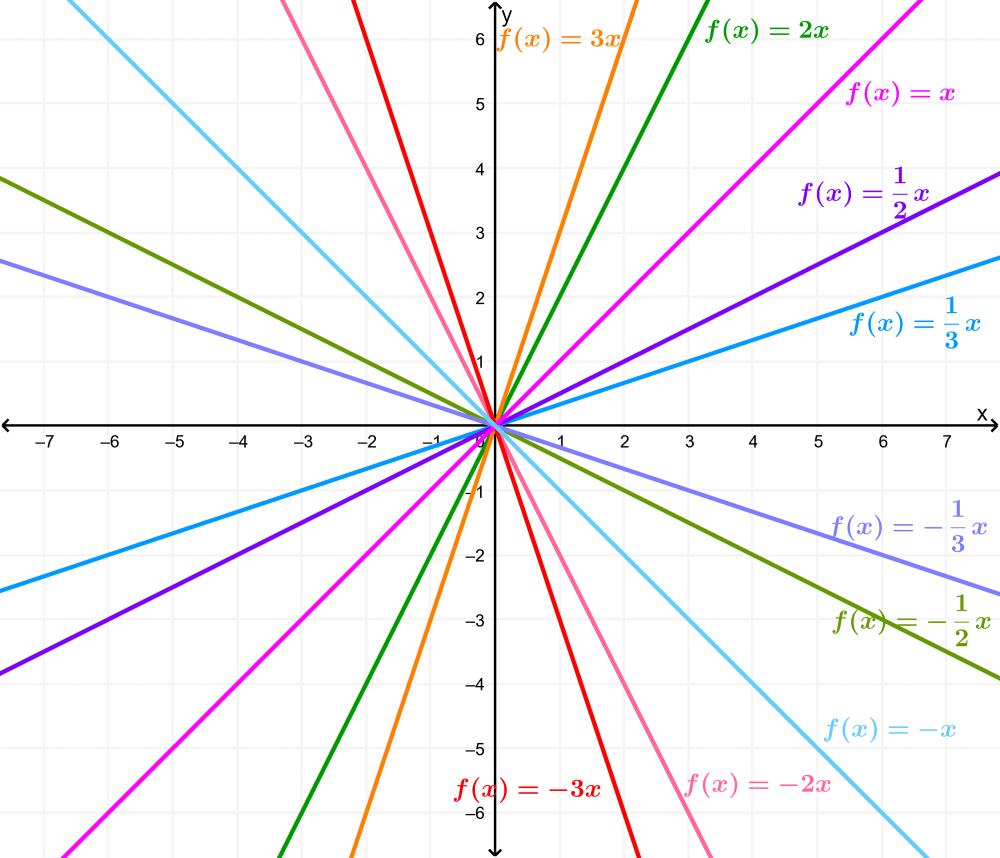
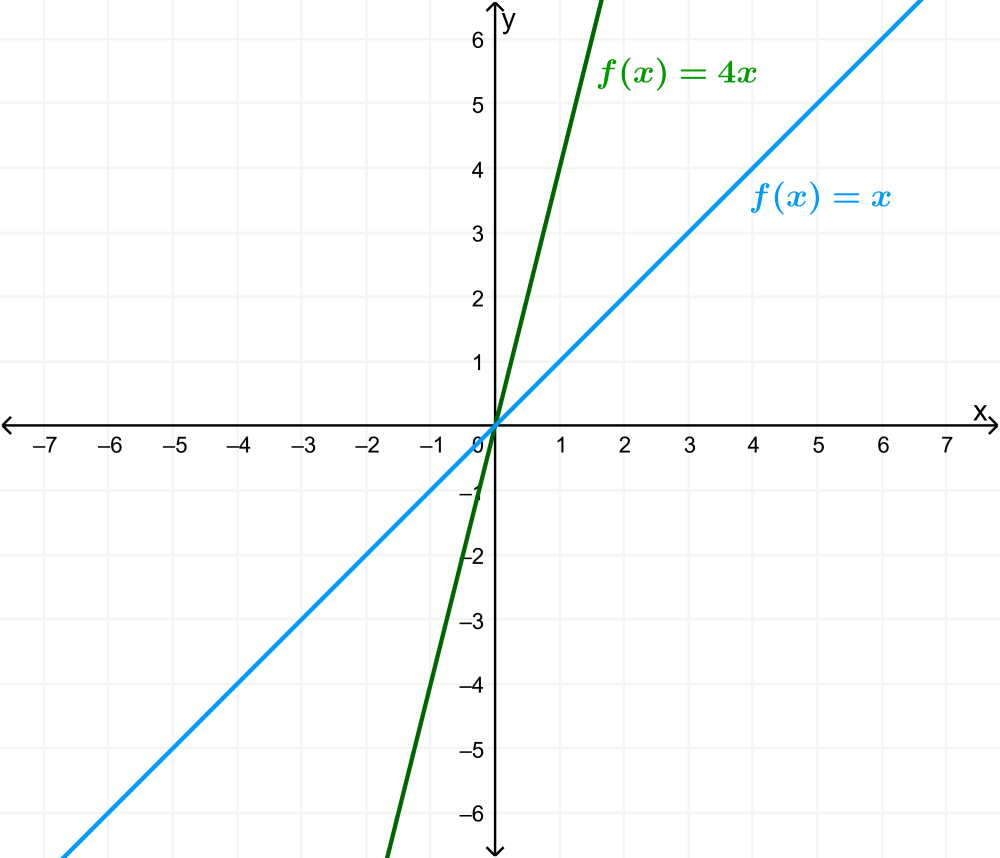
Vertical compression or stretch
In the equation $latex f(x)=mx$, the m is acting as the vertical compression or stretch of the function. When m is negative, we also have a reflection of the function with respect to the x-axis. The larger the value of m, the steeper the line will be:
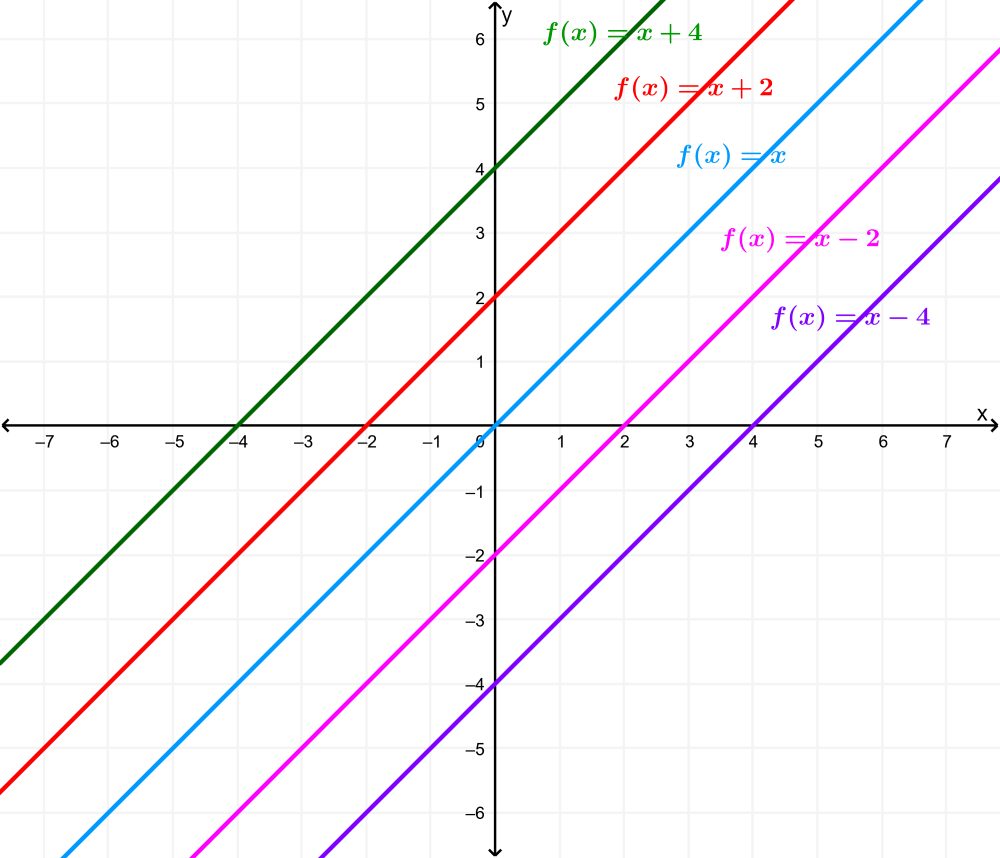
Vertical translation
When we have $latex f(x)=mx+b$, the b acts as the vertical translation, which moves the graph up or down without affecting the slope. If b is positive, the graph is translated b units up and if b is negative, the graph is translated b units down.
How to graph linear functions using transformations?
Step 1: Graph the function $latex f(x)=x$.
Step 2: Stretch or compress the graph vertically by a factor of m.
Step 3: Translate the graph up or down by b units.
EXAMPLE 1
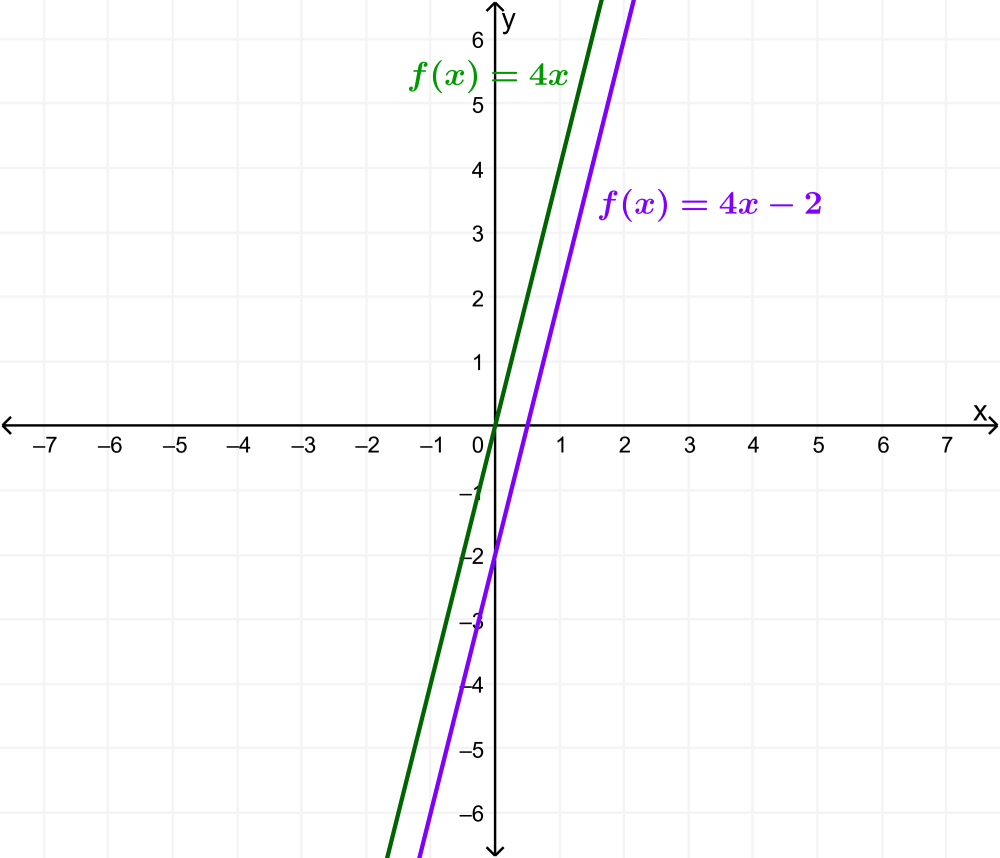
Graph the function $latex f(x)=4x-2$ using transformations.
Solution: The equation of the function shows that $latex m=4$, so the graph is stretched vertically by a factor of 4. The equation of the function also shows that $latex b = -2$, which means that the graph is translated down by 2 units.
First, we graph the identity function and apply vertical stretching:
Then, we apply the vertical translation:
EXAMPLE 2
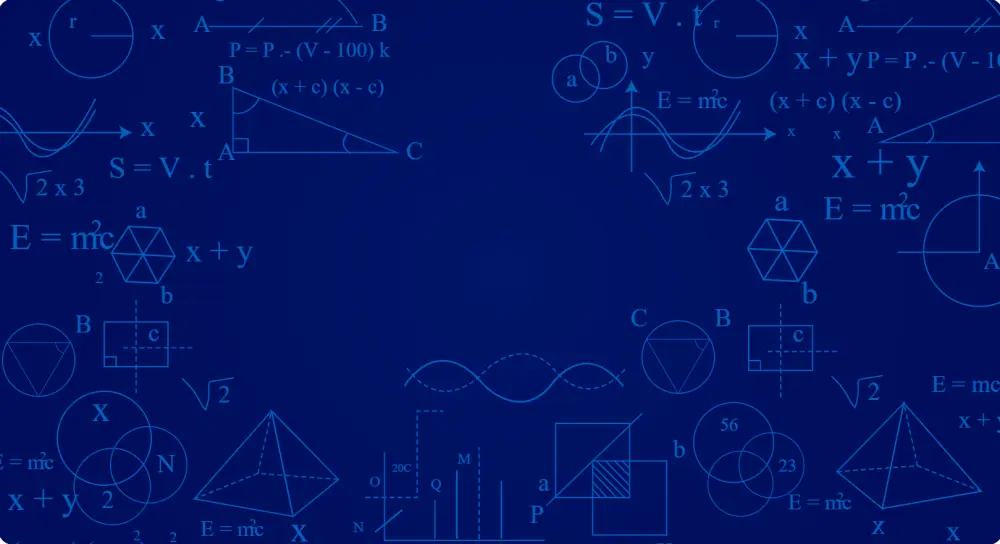
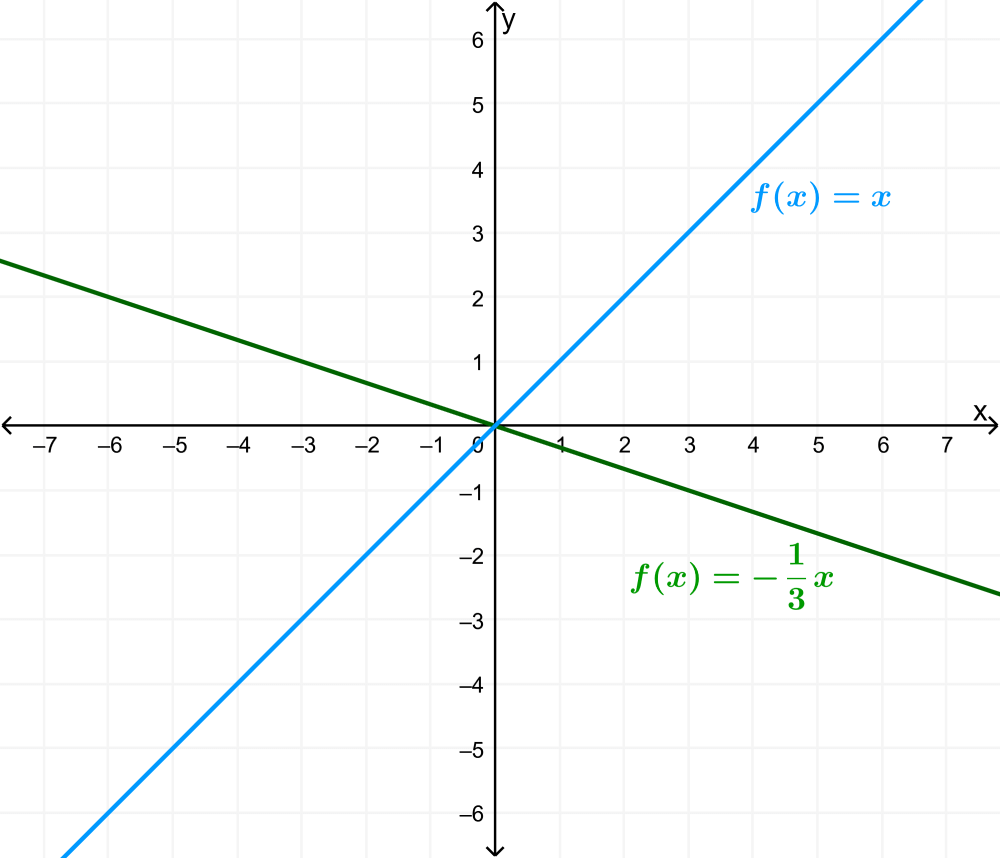
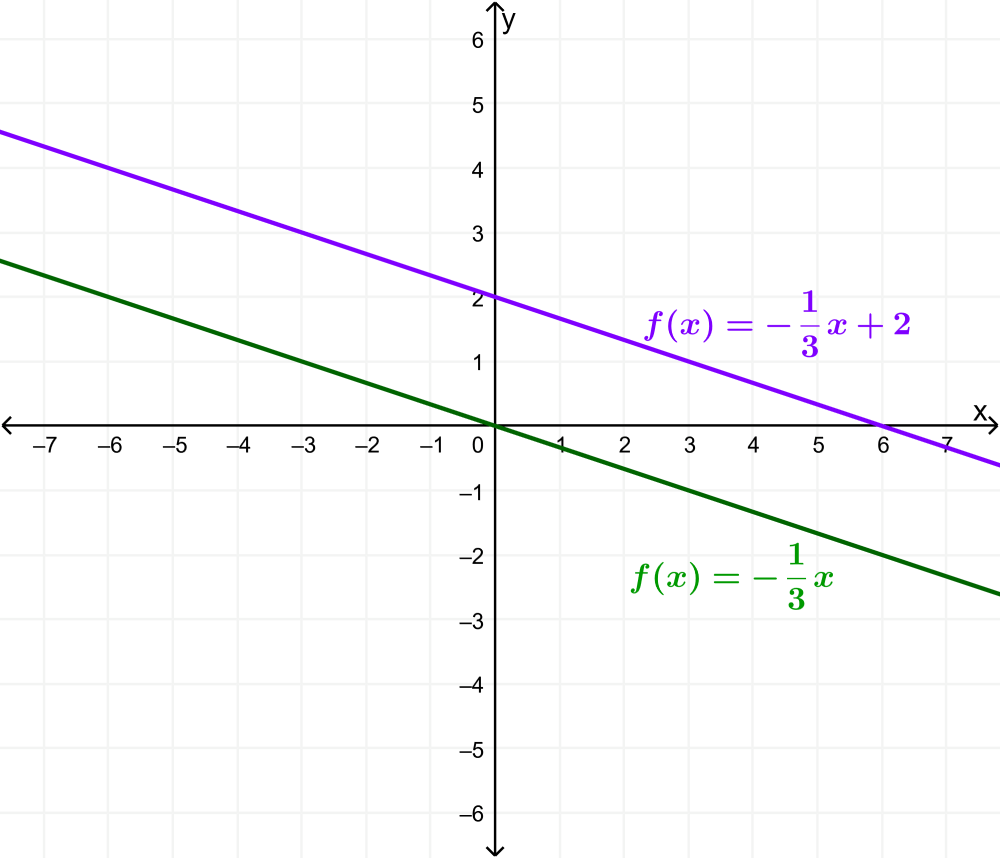
Graph the function $latex f(x)=-\frac{1}{3}x+2$ using transformations.
Solution: We can see that $latex m=-\frac{1}{3}$, so the graph is shrunk vertically by $latex \frac{1} {3}$. We can also see that $latex b = 2$, so we have to translate the graph up by 2 units.
First, we graph the identity function and apply vertical compression:
Then, we apply the vertical translation:
See also
Interested in learning more about graphs of functions? Take a look at these pages:

Jefferson Huera Guzman
Jefferson is the lead author and administrator of Neurochispas.com. The interactive Mathematics and Physics content that I have created has helped many students.