To obtain the graphs of irrational functions, we need to consider the domain of the function. This is because we cannot have a negative value inside a square root. Apart from considering the domain, we also need to plot the graph carefully since it is very easy for most graphs to turn out to be partially wrong.
Since in most cases graphing irrational functions involve square roots, most of the examples presented here will be with square roots.
Graph of the irrational function $latex f\left( x \right)=\sqrt{{2-x}}$
As we have already mentioned, we need to start by checking the domain to know where we should not try to plot points. We know that we cannot have negative numbers within square roots, therefore, we have to consider that and determine for which values of x we can graph without problems.
For example, we know that we cannot have $latex x=4 $since we will get the following:
$latex f\left( x \right)=\sqrt{{2-4}}=\sqrt{{-2}}$
To find the domain of this function, we take the values that are inside the radical and form an inequality with “equal to or greater than zero”. Then, we solve this inequality to find values of x:
$latex 2-x\ge 0$
$latex 2\ge x$
$latex x\le 2$
Now we know that we should not choose any value of x that is greater than 2 for the table of values that we will form. We also know that we should not try to graph anything to the right of 2.
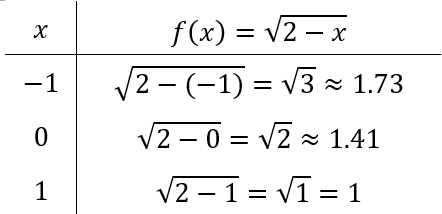
A common mistake many students make is to choose very close values for x and assume that the function can be represented by those values. For example, suppose we choose the following values:
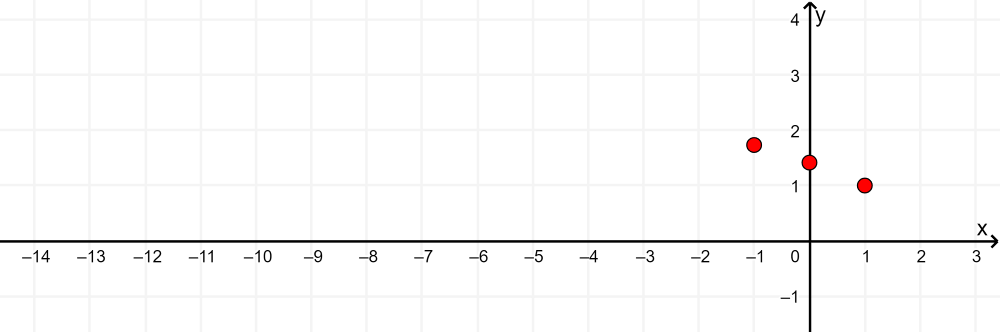
By graphing those points on the Cartesian plane, we get the following:
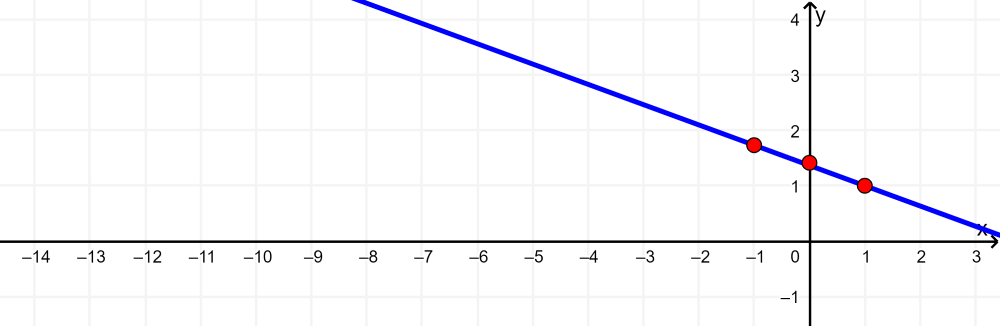
However, the problem occurs when we assume that we can draw a straight line by joining those points:
To avoid this problem, we not only have to choose more values of x, but we have to choose values of x that are more useful. Therefore, we can choose values of x that are a little further apart from each other and also make sure to include the limit point given by the domain $latex x\le 2$.
Forming a table with the mentioned values, we have:
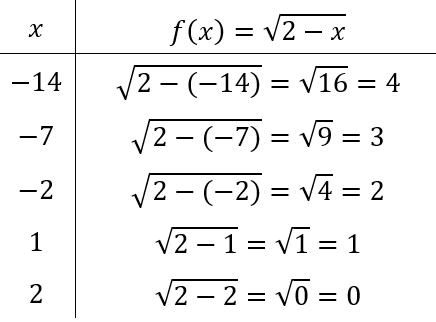
Then, we can graph those points on the Cartesian plane:
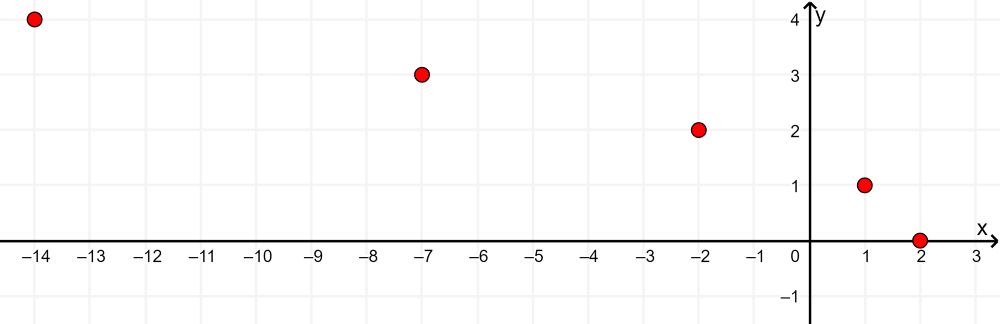
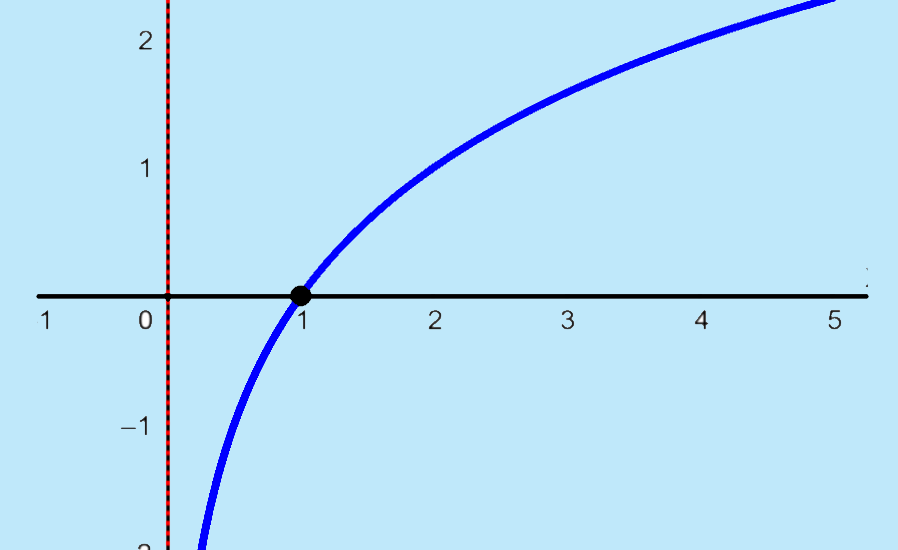
We can see that the points form a curve, so we draw that curve without extending the graph to the right of $latex x=2$:
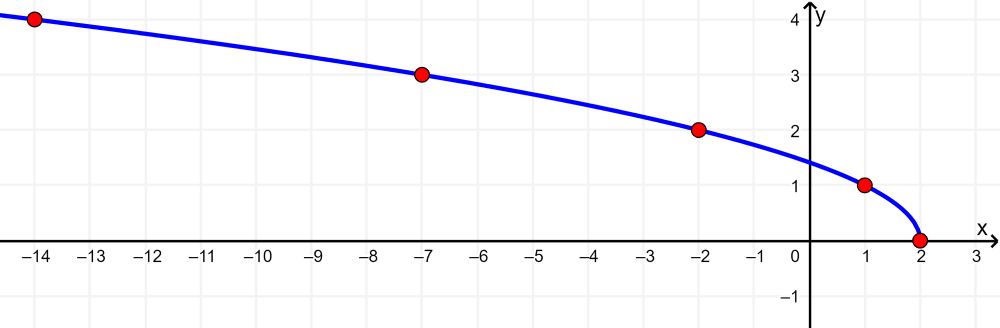
Remember that you should not draw straight lines when graphing irrational functions as these graphs produce curves. Also, remember that it is advisable to take values of x that are separate from each other to get better reference points.
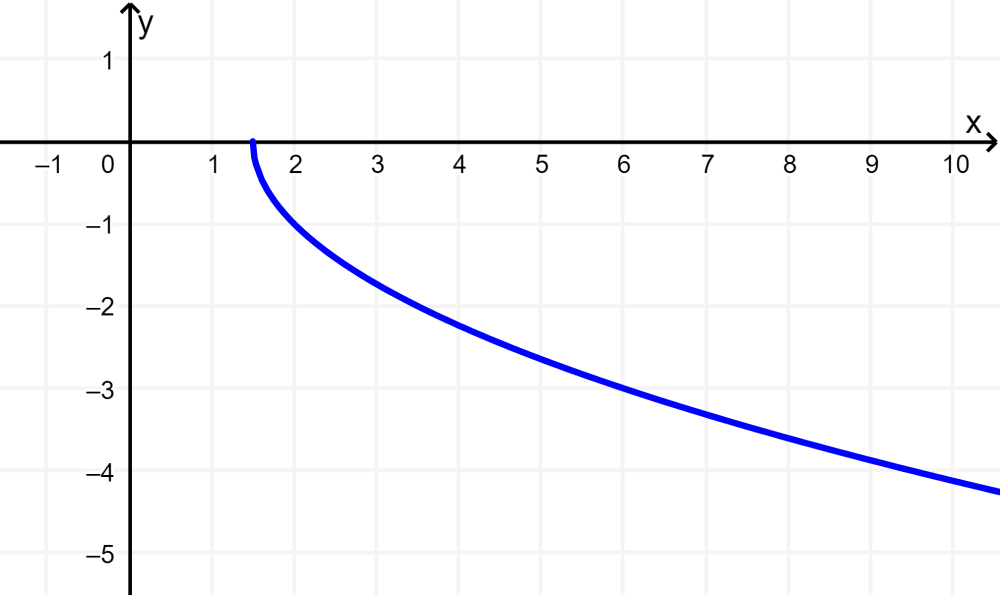
Graph of the irrational function $latex f\left( x \right)=-\sqrt{{2x-3}}$
In the previous example, we were able to use only whole numbers to obtain the points in an easy way. However, this is not always possible. There are times when we will have to use fractions, so we will have to be more careful when plotting the points on the Cartesian plane.
To graph the function $latex f(x)=-\sqrt {{2x-3}}$, again, we start by finding the domain. We will solve the inequality where the values within the radical are non-negative:
$latex 2x-3\ge 0$
$latex 2x\ge 3$
$latex x\ge \frac{3}{2}$
In this case, we know that the first point on the graph will be at $latex x=\frac{3}{2}$, so we will start from there and take larger values of x:
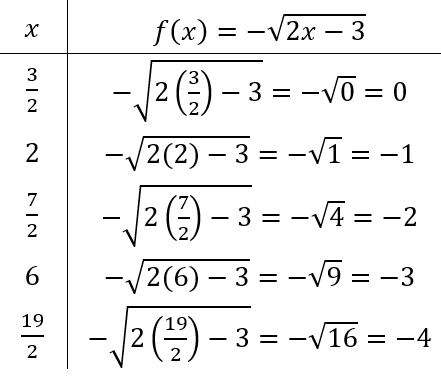
It is possible to obtain integer values of y such as those obtained in the table by thinking about the number that should go inside the square root and then finding the corresponding x value.
Plotting the points and drawing the curve that joins these points, we obtain the following graph:
Graph of the irrational function $latex f\left( x \right)=2\sqrt{{3x+2}}-1$
We need to find the domain of the function. We form an inequality so that the values within the square root are greater than zero:
$latex 3x+2\ge 0$
$latex 3x\ge -2$
$latex x\ge \frac{-2}{3}$
Now, we need to find several points on the graph that are separated from each other to make plotting the graph easier. We start with the point $latex x=\frac{-2}{3}$ and take larger values to the right:

Again, the points were found by thinking about the values we must have within the square root to produce whole numbers and then determining the corresponding x value. By plotting the points and drawing the curve, we have the following:
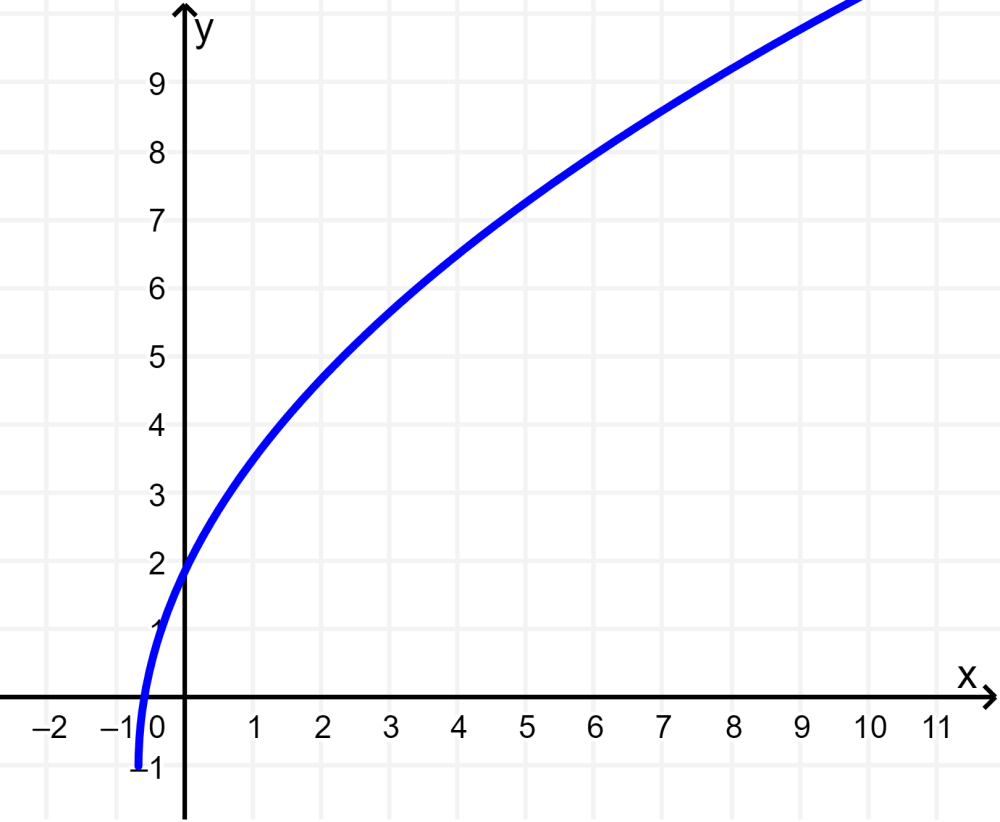
Notice that the graph grows to the right indefinitely, but because the domain is restricted to $latex x\ge \frac{-2}{3}$, we do not have more values to the left and the graph starts at the point $latex (\frac{- 2}{3}, ~-1)$.
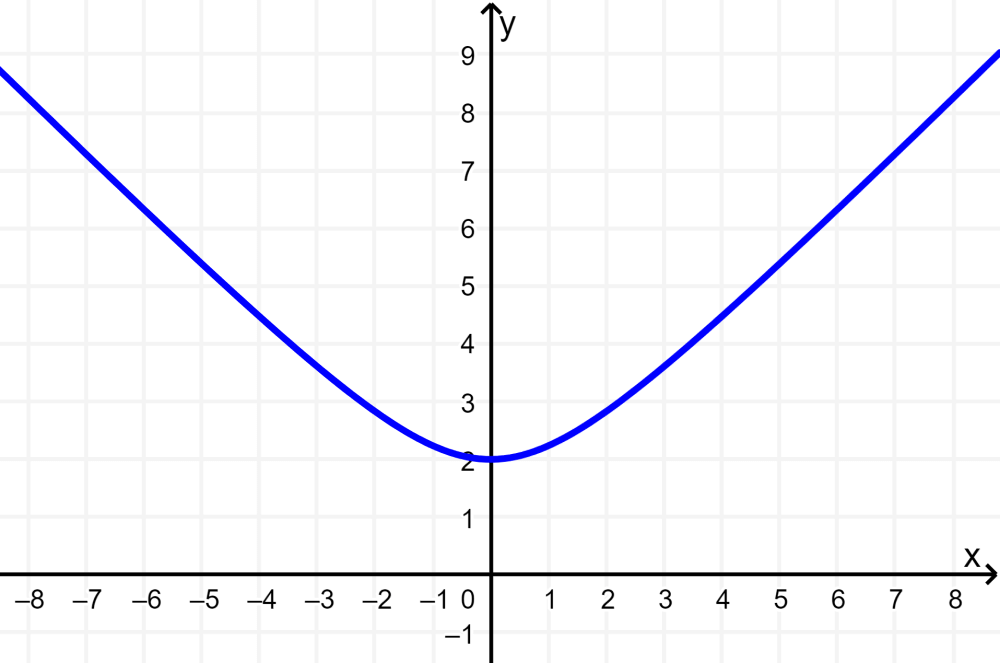
Graph of the irrational function $latex f\left( x \right)=\sqrt{{{{x}^{2}}+4}}$
Again, we have to start by finding the domain of the function. To do this, we have to solve the quadratic that is inside the square root, but we can also use the graph of this quadratic function:
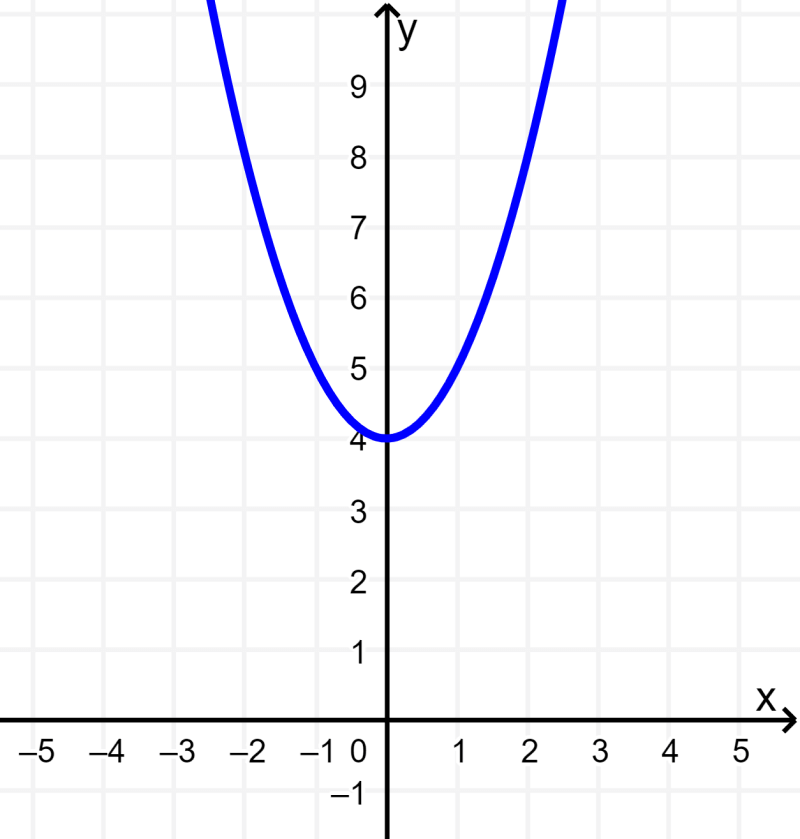
Since the parabola is always on the x-axis, then $latex {{x}^2}+4$ is always positive. Since the expression inside the square root is always positive, the values of x can be anything, that is, we have no restrictions on the domain of this irrational function.
We can prove this algebraically:
$latex {{x}^{2}}+4\ge 0$
$latex {{x}^{2}}\ge -4$
Since any number squared will be equal to zero or greater than zero, we know that we can use any value of x.
We can form our table with different values of x. This time, it is a bit more difficult to find integer values, so we can get decimal values:
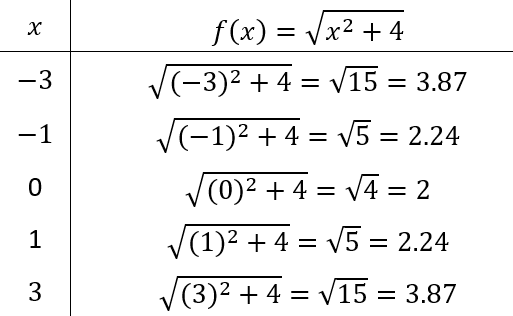
Using those points and plotting the graph, we obtain the following:
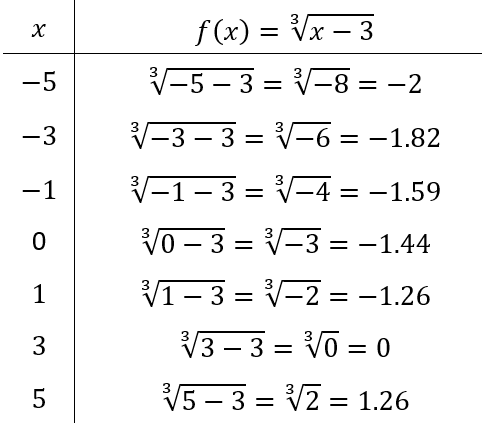
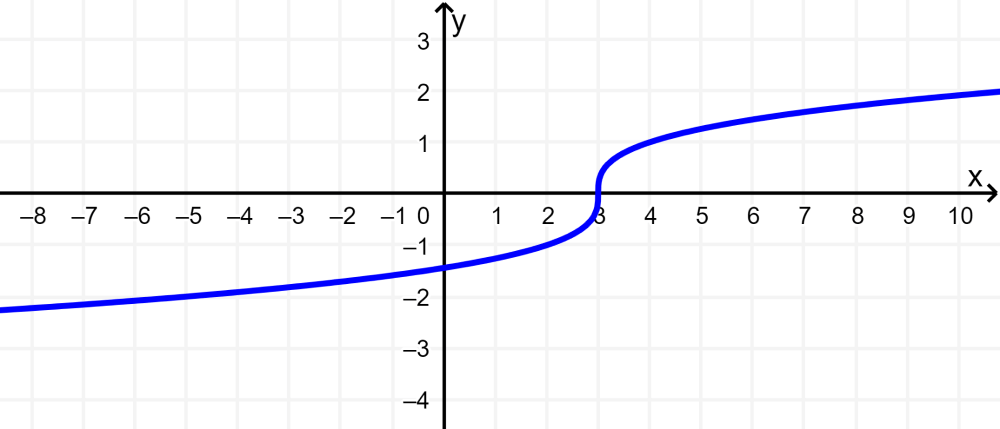
Graph of the irrational function $latex f\left( x \right)=\sqrt[3]{{x-3}}$
Most irrational functions involve square roots. But we can also graph other irrational functions. For example, we will graph the function $latex f(x)=\sqrt[3]{{x-3}}$.
In this case, we do not have limitations with the domain since we have a cubic irrational function. This is because we can have negative values within a cube root. In fact, we can have negative values at any root with an odd index. So the domain is all real numbers of x.
Again, we have to find points to plot and we can form our table with different values of x. Using a calculator, we find the following values:
Plotting these points on the Cartesian plane and drawing the curve, we obtain the following graph:
See also
Interested in learning more about graphs of functions? Take a look at these pages:

Jefferson Huera Guzman
Jefferson is the lead author and administrator of Neurochispas.com. The interactive Mathematics and Physics content that I have created has helped many students.