The graph of a quadratic function has a U-shaped curve and is called a parabola. We can graph a quadratic function using its key points, such as its x-intercepts, its vertex, and its axis of symmetry. The parts of a parabola give us important information about a quadratic function.
In this article, we will learn about the different parts of the graphs of quadratic functions and we will graph these functions in their vertex form and their standard form.
Different parts of parabolas
Recall that a quadratic function has the form $latex f (x)=a{{x}^2}+bx+c$, where a, b and c are constants and $latex a\ne 0$.
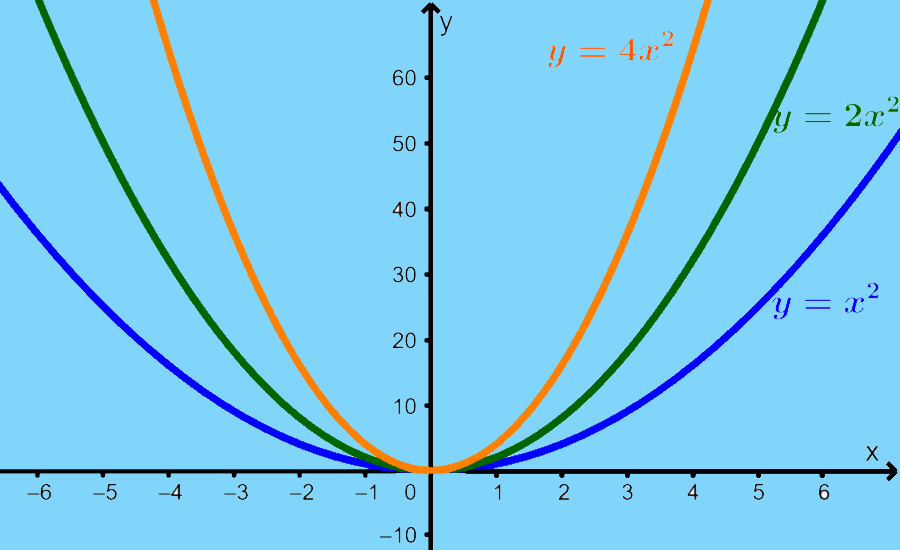
The graphs of quadratic functions are U-shaped as shown below:
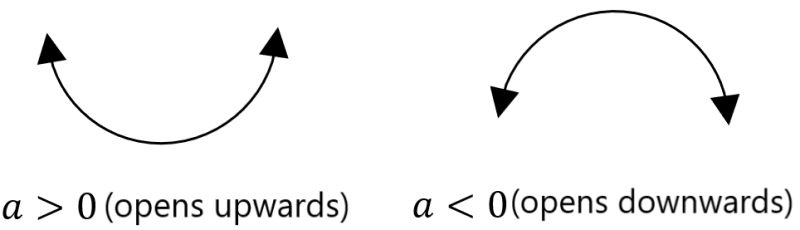
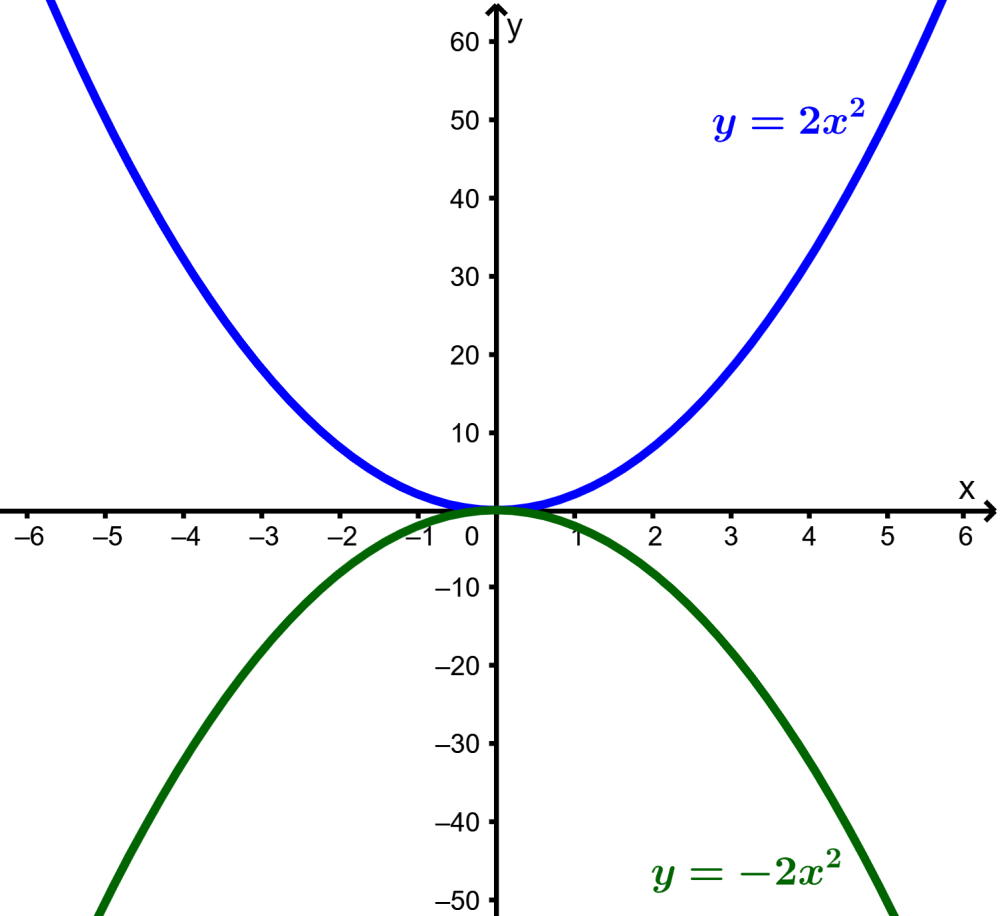
The sign in the coefficient a determines whether the graph opens up or opens down. If $latex a> 0$, the graph opens up, and if $latex a <0$, the graph opens down.
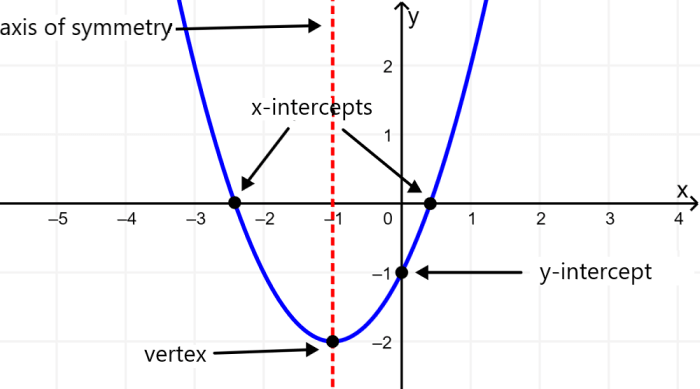
Parabolas have different parameters that determine their shape and their location in the Cartesian plane. These parameters are the vertex, the axis of symmetry, the y-intercept, and the x-intercepts.
Vertex
The vertex is the extreme point on the graph of a quadratic function, that is, it is the highest point or the lowest point. If the parabola opens upwards, the vertex represents the lowest point and if the parabola opens downwards, the vertex represents the highest point.
Axis of symmetry
All parabolas are symmetric with respect to a vertical line called the axis of symmetry. This vertical line passes through the vertex.
y-intercept
The y-intercept is the point where the parabola crosses the y-axis. For all graphs of quadratic functions, there is a single y-intercept. If there were more y-intercepts, the graph would not represent a function.
x-intercepts
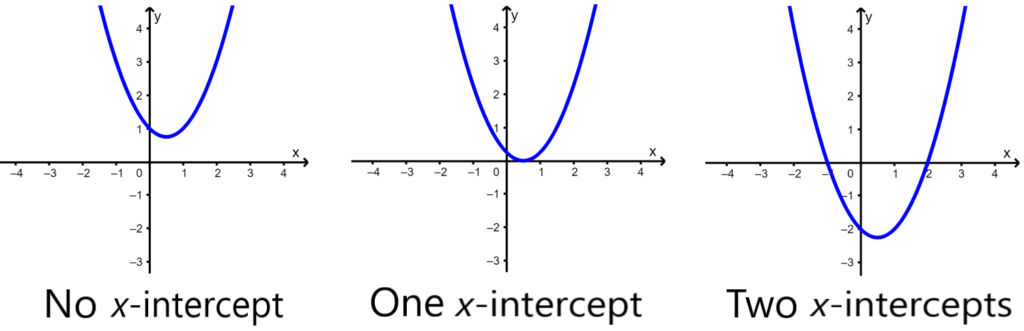
The x-intercepts are the points where the parabola crosses the x-axis. The x-intercepts represent the zeros or the roots of the quadratic function, that is, the values of x when we have $latex y = 0$. It is possible to have zero x-intercepts, one x-intercept, and two x-intercepts.
The number of intercepts depends on the location of the graph of the quadratic function. When the parabola has two x-intercepts, the vertex always lies between these intercepts due to the symmetry of the graph.
Graphical interpretation of the solutions of quadratic functions
We can find the roots of quadratic functions algebraically or graphically.
To find the roots algebraically, we can use the quadratic formula $latex x = \frac{{-b\pm \sqrt{{{{b} ^ {2}}- 4ac}}}}{{2a}}$. We can also find the roots graphically by making several observations of the graph of a quadratic function.
Let’s look at the connection between finding roots algebraically and graphically with the graph of the function $latex f (x) = {{x} ^ {2}} + x-2$:
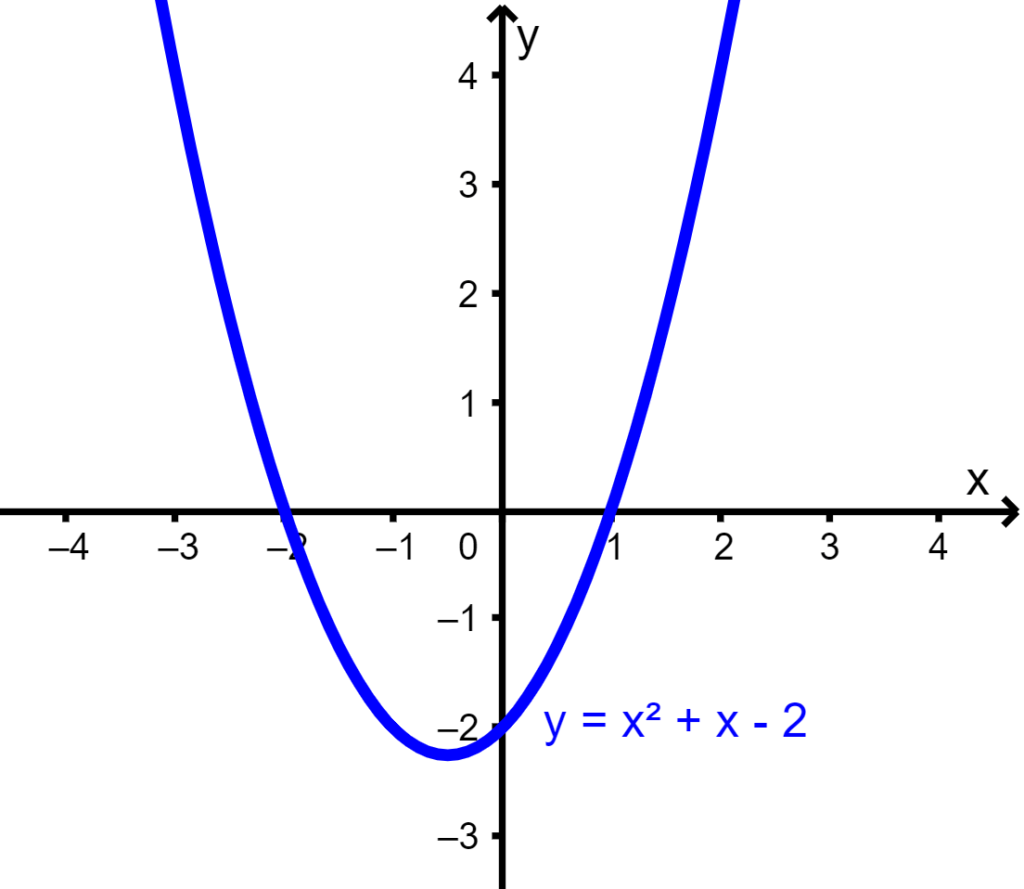
We can see that the graph crosses the x-axis at the points (-2, 0) and (1, 0). We know that the x-intercepts represent the roots of the quadratic function, so $latex x = -2$ and $latex x = 1$ are the roots.
Now let’s find the roots of $latex f(x) = {{x}^2}+x-2$ algebraically. We can use the quadratic formula with the coefficients $latex a = 1, ~b = 1, ~c = -2$.
$latex x=\frac{{-1\pm \sqrt{{{{1}^{2}}-4\left( 1 \right)\left( {-2} \right)}}}}{{2\left( 1 \right)}}$
$latex x=\frac{{-1\pm \sqrt{9}}}{2}$
$latex x=\frac{{-1\pm 3}}{{2}}$
Therefore, we have two possible values for x: $latex x=\frac{{-1+3}}{{2}}$ and $latex x=\frac{{-1-3}}{{2}}$. By simplifying these values, we get $latex x=1$ y $latex x=-2$.These are the same values that we find graphically.
EXAMPLE
Find the roots of the function $latex f(x)={{x}^{2}}+2x+3$ algebraically and graphically:
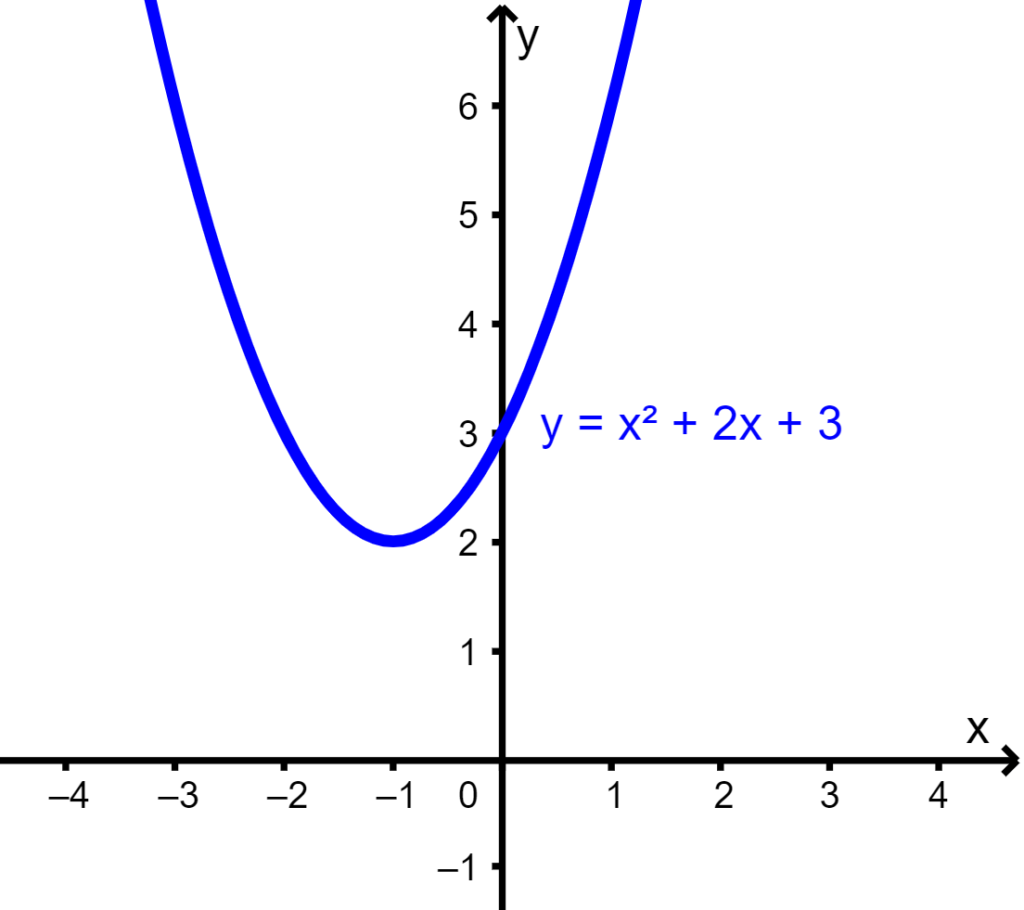
We can see that the graph does not cross the x-axis, therefore, it does not have real roots. We can verify this algebraically.
We will use the quadratic formula with the coefficients $latex a=1, ~b = 2, ~c = 3$.
$latex x=\frac{{-2\pm \sqrt{{{{2}^{2}}-4\left( 1 \right)\left( {3} \right)}}}}{{2\left( 1 \right)}}$
$latex x=\frac{{1\pm \sqrt{-9}}}{2}$
We see that we have $latex \sqrt{{- 8}}$, which is not a real number. This means that the quadratic function has no real roots.
Graphs of quadratic functions in vertex form
The vertex form of a quadratic function allows us to find the vertex of the graph easily.
Quadratic equations can be presented in different ways. For example, we have already seen its standard form:
$latex f\left( x \right)=a{{x}^{2}}+bx+c$
Another common form is the vertex form:
$latex f\left( x \right)=a{{(x-h)}^{2}}+k$
In this form, the vertex is the point $latex (h, k)$. As we saw earlier, the coefficient $latex a$ determines whether the parabola opens up or down.
Transform from vertex shape to standard shape
To transform a quadratic function written in vertex form to standard form, we simply expand the squared expression and combine like terms. For example, the following quadratic:
$latex f\left( x \right)={{(x-5)}^{2}}+4$
can be rewritten like this:
$latex f\left( x \right)=(x-5)(x-5)+4$
$latex f\left( x \right)={{x}^{2}}-5x-5x+25+4$
$latex f\left( x \right)={{x}^{2}}-10x+29$
Transform from standard form to vertex form
This is a bit more difficult and we have to use a process called “complete the square”.
When we have $latex a=1$
Suppose we want to write $latex f\left( x \right)={{x}^{2}}+2x+3$ in vertex form. We observe that the coefficient of the term $latex x^2$ is 1. When this is the case, we look at the coefficient of the term x and take its half.
Then we square that number. That is, in this case, we have 2, taking its half we have 1, and squared it, we have 1. Then, we add and subtract this number as shown below:
$latex f\left( x \right)=({{x}^{2}}+2x+1)+3-1$
Here, we add and subtract the same number, so we don’t actually change the function. Now, the expression in the parentheses can be written as a square and we have:
$latex f\left( x \right)={{(x+1)}^{2}}+2$
In this way, the vertex is $latex (-1, 2)$.
When we have $latex a\ne 1$
This is a bit more difficult than the previous case, but we can use the same idea to transform the function. Suppose we want to write $latex f\left( x \right)=2{{x}^{2}}+12x-4$ in vertex form. Now, the coefficient of the term $latex {{x}^{2}}$ is 2. We can factor the 2 of the first two terms:
$latex f\left( x \right)=2({{x}^{2}}+6x)-4$
Therefore, we complete the square inside the parentheses. We observe that half of 6 is 3 and squared is 9, so we add and subtract 9 within the parentheses :
$latex f\left( x \right)=2({{x}^{2}}+6x+9-9)-4$
and we solve as follows:
$latex f\left( x \right)=2({{(x+3)}^{2}}-9)-4$
$latex f\left( x \right)=2{{(x+3)}^{2}}-18-4$
$latex f\left( x \right)={{(x+3}^{2}}-11$
Thus, the vertex of the graph is $latex (-3, -11)$.
Graphs of quadratic functions in standard form
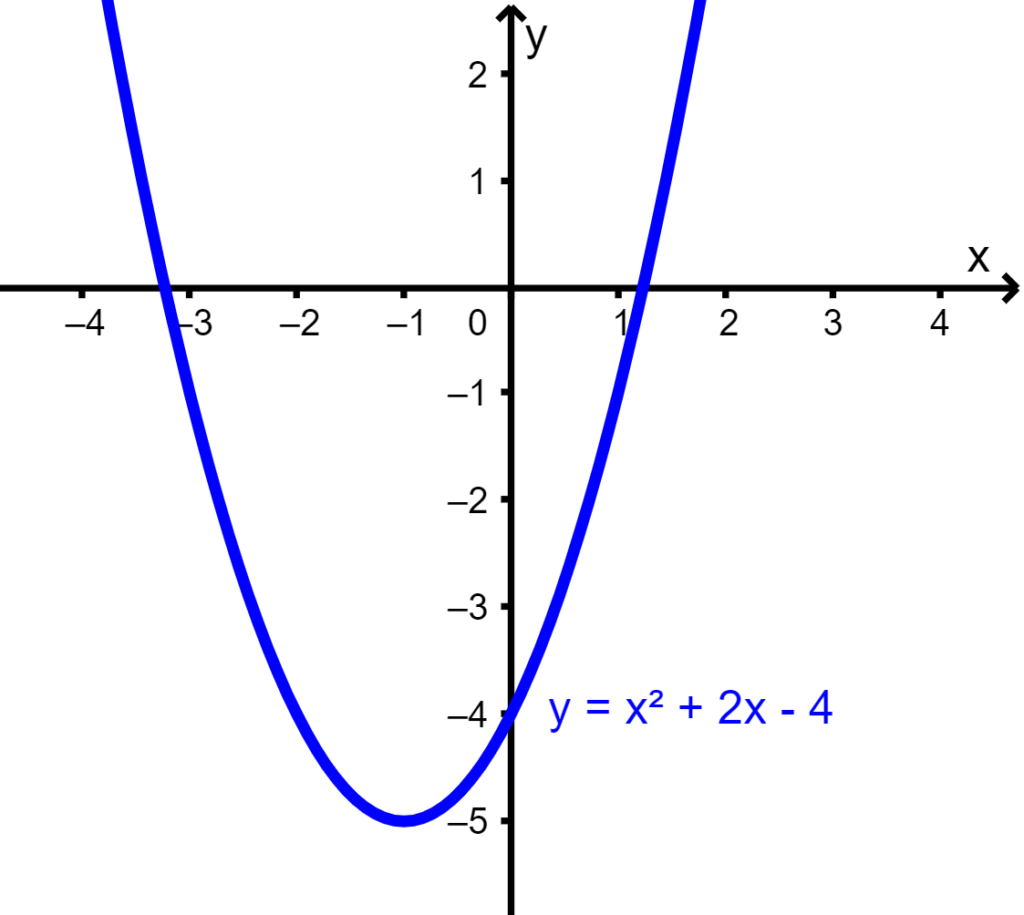
A quadratic function in the form $latex f (x) = a {{x} ^ {2}} + bx + c$ is in standard form. Regardless of the format, the graph of a quadratic function is a parabola. For example, the following is the graph of $latex f(x ) = x^2 + 2x-4$:
Each coefficient of a quadratic function has an impact on the shape and location of the graph on the Cartesian plane.
Coefficient of $latex {{x} ^2}, ~a$
The coefficient a controls the rate of increase or decrease of the function from the vertex. The larger and positive a is, the faster the quadratic function will grow and the graph will appear to get “thinner.”
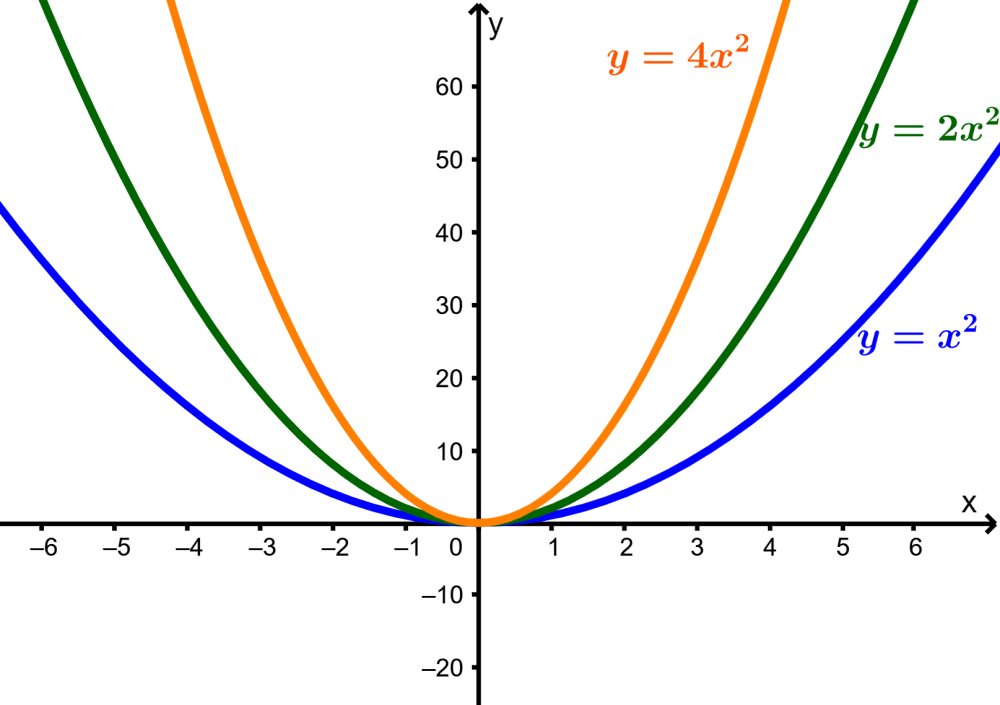
The coefficient a also controls where the parabola will open. If we have $latex a> 0$, the graph opens up and if we have $latex a<0$, the graph opens down.
Axis of symmetry
The coefficients a and b control the axis of symmetry and the x-coordinate of the vertex of the parabola. We can find the axis of symmetry of a parabola as follows:
$latex x=-\frac{b}{{2a}}$
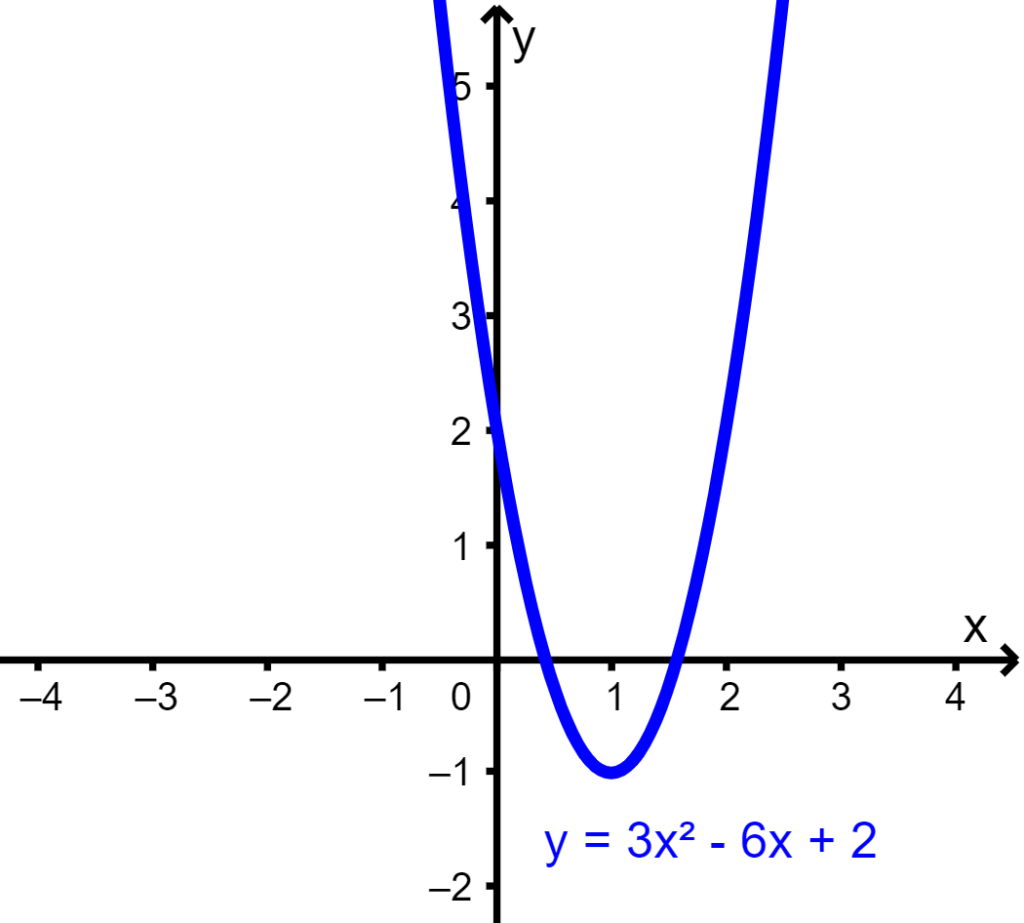
For example, in the parabola $latex f (x) = 3{{x}^{2}} – 6x + 2$, we have $latex a = 3, ~b = -6$, so we have $latex x = – \frac{- 6}{{2 (3)}} = 1$. The vertex has an x coordinate of 1:
The y-intercept of the parabola
The coefficient c controls the vertical position of the parabola. This is the point where the parabola intersects the y-axis. The point (0, y) is the y-intercept of the parabola. In this case, $latex c = 2$ and the parabola intersects the y-axis at the point (0, 2).
See also
Interested in learning more about graphs of functions? Take a look at these pages:

Jefferson Huera Guzman
Jefferson is the lead author and administrator of Neurochispas.com. The interactive Mathematics and Physics content that I have created has helped many students.