Sine, cosine, and tangent are the most important trigonometric functions. To obtain the graphs of trigonometric functions we need to know the period, phase, and amplitude. The graphs of cosecant, secant and cotangent are obtained considering that they are the reciprocal functions of sine, cosine and tangent respectively.
In this article, we will learn about the graphical representations of the sine, cosine, and tangent functions. We will also learn about the amplitude, phase, and period of these functions.
- Graph of the sine function
- Graph of the cosine function
- Graph of the tangent function
- Graph of the cosecant function
- Graph of the secant function
- Graph of the cotangent function
- Amplitude of trigonometric functions
- Period of trigonometric functions
- Phase of trigonometric functions
- How to graph trigonometric functions?
- See also
Graph of the sine function
The sine function is one of the fundamental trigonometric functions. We can write $latex y=\sin(x)$ or $latex f(x)=\sin(x)$. The following is the graph of the sine:
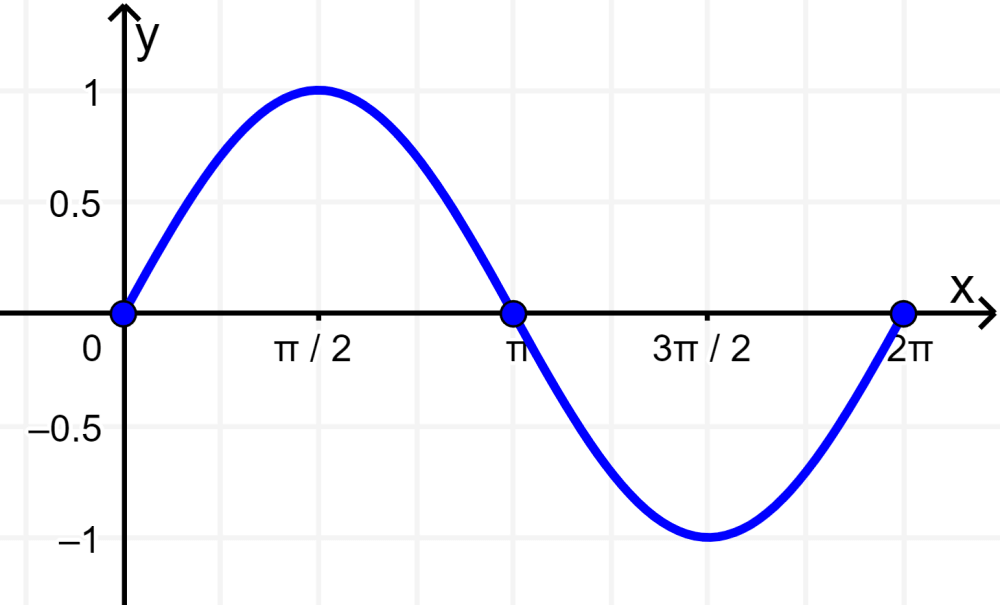
The sine function has the following characteristics:
- The roots or zeros of $latex y=\sin(x)$ are multiples of π.
- The graph of sine passes through the origin since when x is 0, we have $latex \sin(0) = 0$.
- The period of sine function is 2π.
- The curve height at each point is equal to the value of the sine function at each point.
- The maximum value of the function is 1. This happens when $latex x=\frac{\pi}{2}$.
- The minimum value of the function is -1. This happens when $latex x=\frac{3\pi}{2}$.
Graph of the cosine function
For the cosine function, we can write $latex y=\cos(x)$ or $latex f(x)=\cos(x)$. The following is the graph of cosine:
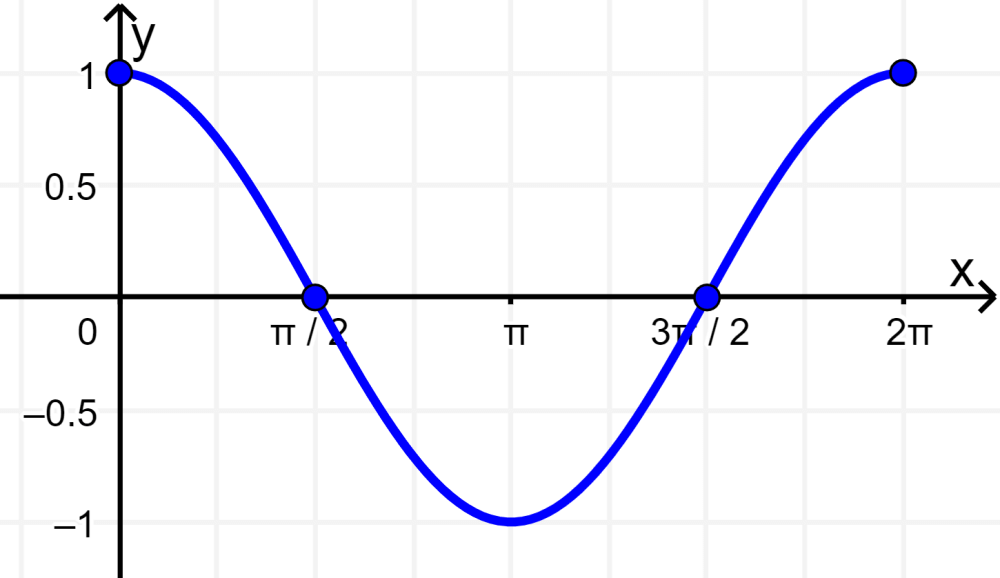
The following are the characteristics of the graph of the cosine function:
- We have this identity $latex \sin(x+\frac{\pi} {2}) = \cos(x )$.
- The graph of the cosine function is the graph that we obtain if we translate the graph of $latex \sin\frac{\pi} {2}$ units to the left.
- The roots or zeros of the cosine function are the multiples of $latex \frac{\pi} {2}$.
- The graph of the cosine function crosses the y-axis at the point (0, 1).
- The period of the cosine function is 2π.
- The maximum value of the function is 1. This happens when $latex x=0$.
- The minimum value of the function is -1. This happens when x is π.
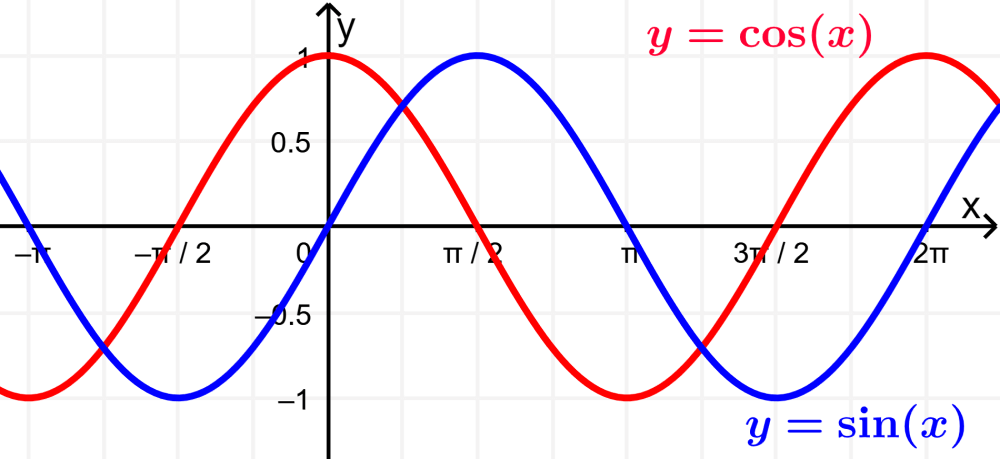
We can observe the following similarities between sine graphs and cosine graphs:
- They both produce the same curve, which is translated along the x-axis.
- They both have an amplitude of 1.
- They both have a period of 2π or 360°.
The following graph shows us a comparison of the sine and cosine functions:
Graph of the tangent function
The graph of the tangent is completely different compared to the graph of the sine and the cosine functions. The graph of the tangent function has y values ranging from negative infinity to positive infinity and crosses the x-axis over a period of π radians:
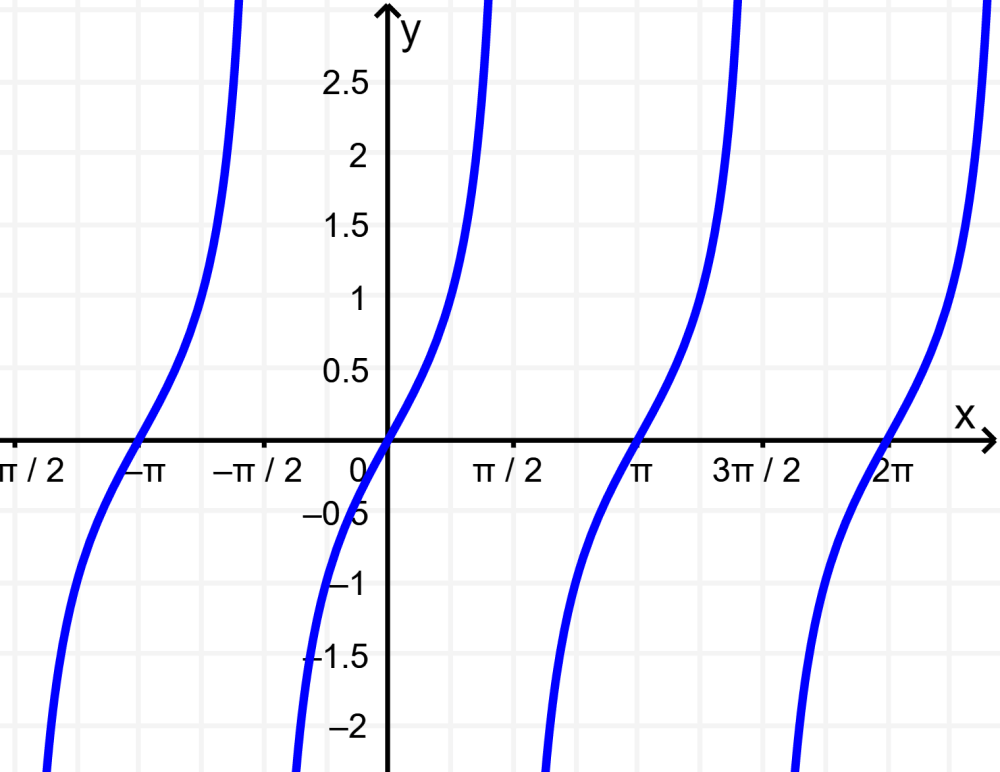
The following are the characteristics of the tangent function:
- The roots or zeros of the function are the multiples of π.
- The graph of the tangent passes through the origin.
- The graph of the tangent has an indefinite amplitude because the curve goes to infinity.
- The period of the sine function is π or 180°.
Graph of the cosecant function
The cosecant is the reciprocal function of the sine. This means that the cosecant function is obtained by dividing 1 by the sine. Therefore, the cosecant function becomes undefined when the sine is equal to 0 (multiples of π).
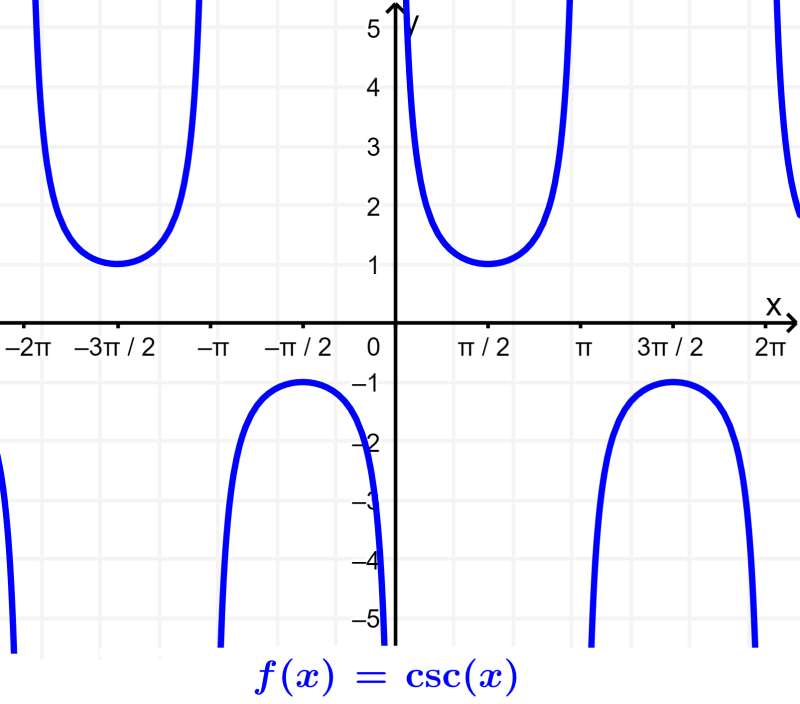
The following are some important features of the cosecant function:
- The cosecant has no roots or zeros. We can see that the graph does not touch the x-axis.
- The cosecant is undefined on multiples of π. That is, it has asymptotes at these points.
- The range of the cosecant function is all real numbers except -1<y<1.
- The graph of cosecant has an undefined amplitude.
- The period of the cosecant function is 2π or 360°.
Graph of the secant function
The secant is the reciprocal function of the cosine. That is, we can obtain the secant function by dividing 1 by the cosine. Therefore, the secant function becomes undefined when the cosine is equal to 0 (π/2±nπ, where n is an integer).
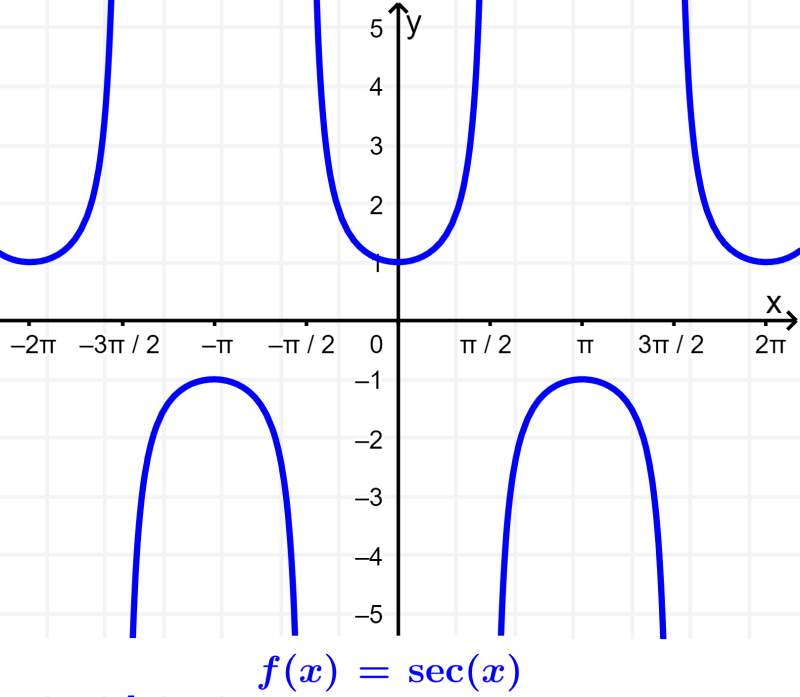
The following are some important features of the secant function:
- The secant function never touches the x-axis. This means that it has no roots or zeros.
- The secant has asymptotes at multiples of π/2, since it is undefined at these points.
- The range of the secant function is all real numbers except -1<y<1.
- The secant has an undefined amplitude.
- The period of the secant function is 2π or 360°.
Graph of the cotangent function
The cotangent is the reciprocal function of the tangent. That is, the cotangent is equivalent to 1 on the tangent function. Therefore, the cotangent function results in undefined when the tangent is equal to 0 (multiples of π).
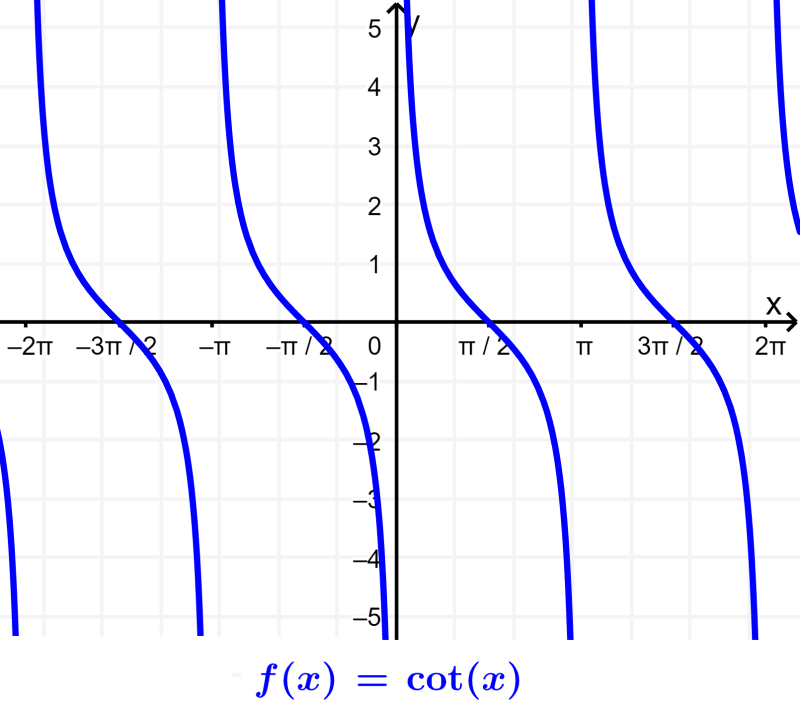
The following are some important features of the cotangent function:
- The zeros or roots of the cotangent are located at π/2±nπ, where n is an integer.
- The cotangent is undefined on multiples of π. That is, it has asymptotes at these points.
- The range of the cotangent is all real numbers.
- The graph of the cotangent has an undefined amplitude.
- The period of the cotangent function is π or 180°.
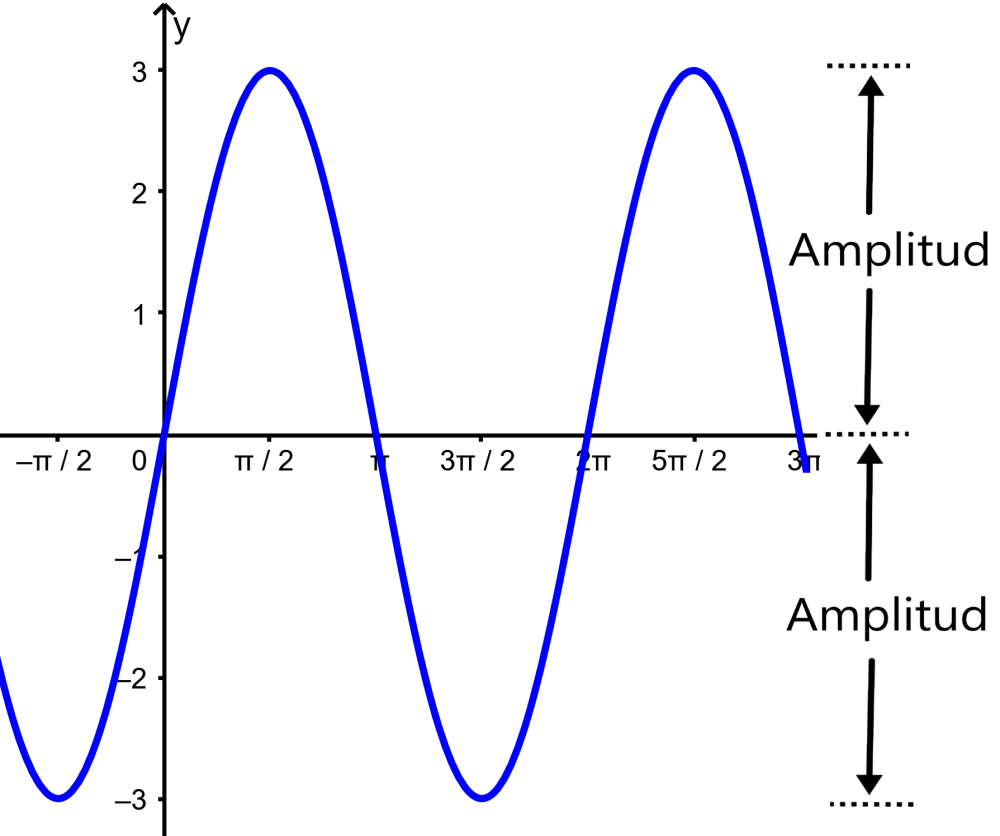
Amplitude of trigonometric functions
The amplitude of trigonometric functions is the distance from the centerline of a trigonometric function to its maximum or minimum point. The amplitude is the absolute value by which a trigonometric function is multiplied.
The amplitude of a function can also be measured by measuring the distance of the highest point from the lowest point and dividing by 2. The amplitude tells us how high or low the graph of a trigonometric function is.
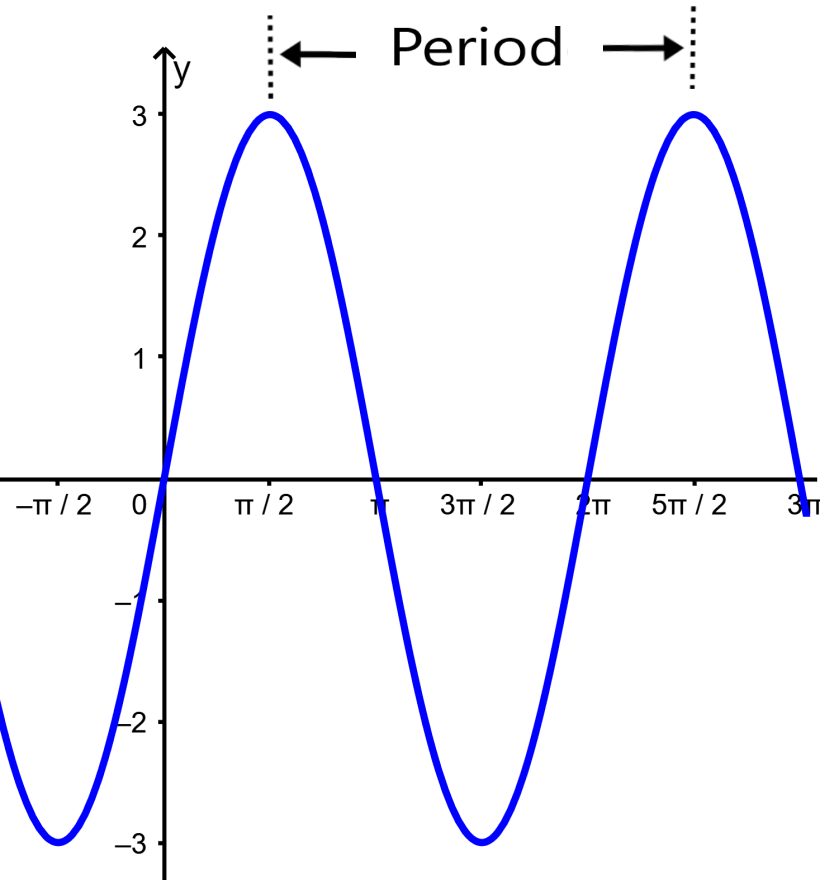
Period of trigonometric functions
The period is the measure from one point on the graph, for example, a maximum point, to the next equivalent point. The following is a graphical representation of the period of the sine function:
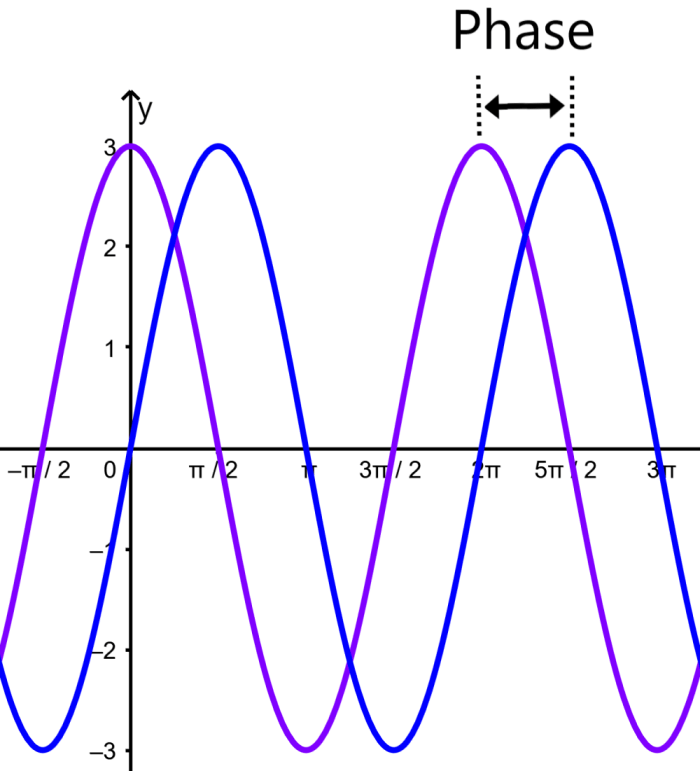
Phase of trigonometric functions
The phase is a measure of the horizontal translation of a trigonometric function from its original position. The following is a graphical representation of the phase of the sine function:
How to graph trigonometric functions?
There are several methods that can be used to graph trigonometric functions. The following is a detailed explanation of one of the most efficient methods for graphing trigonometric functions.
To plot the graph of trigonometric functions, we have to start by converting the given function to the general form $latex f(x)=a\sin(bx-c) + d$. In this way, we can easily find the different parameters such as amplitude, phase, period, and vertical translation, where:
- $latex |a|=$ amplitude
- $latex \frac{{2\pi}}{|b|}=$ period
- $latex \frac{{c}}{b}=$ phase
- $latex d=$ vertical translation
Similarly, we can find the graph of the cosine function using the form $latex f(x)=a\cos(bx-c)+d$.
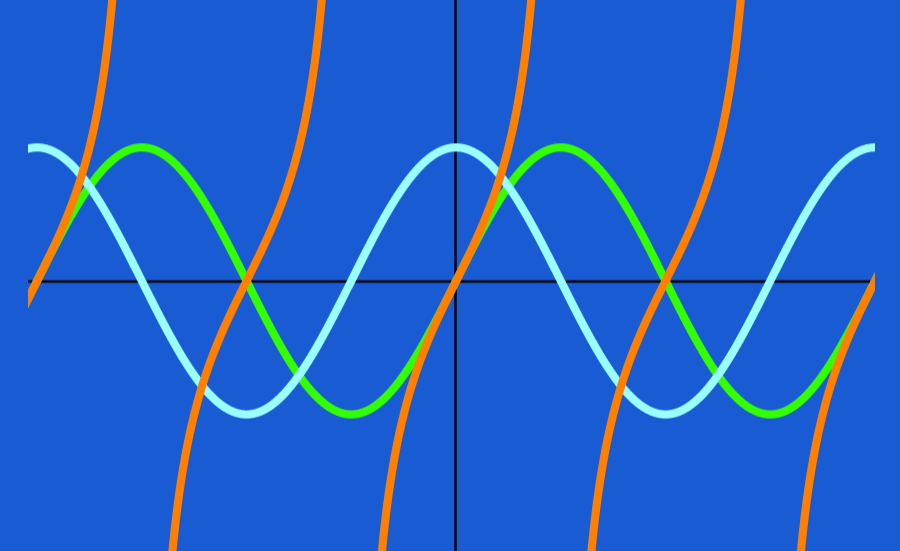
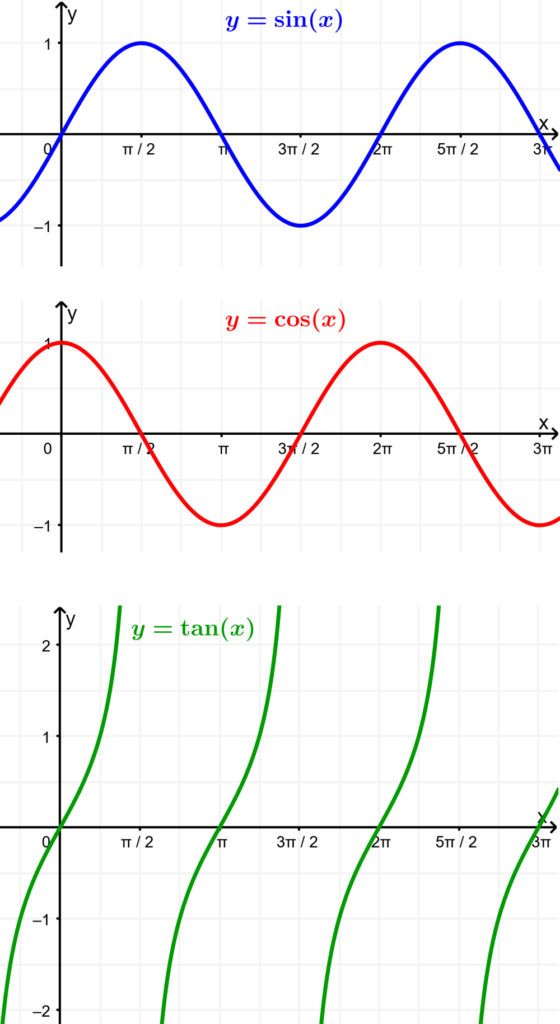
The graphs of the fundamental trigonometric functions are shown below in their base form:
EXAMPLE 1
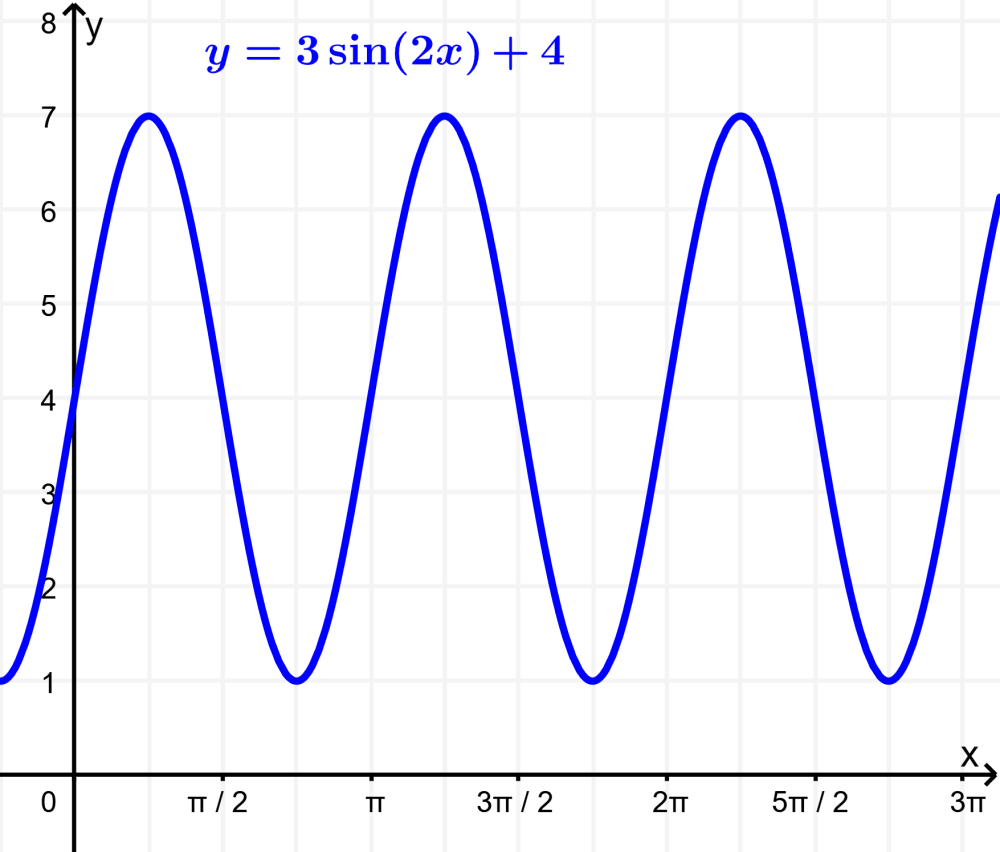
Sketch the graph of the function $latex y=3\sin({2x})+4$.
Solution:
- The amplitude is 3, so the distance between the minimum and maximum values is 6.
- The number of waves is 2. Each wave has a period of 360°÷2=180°.
- The graph is translated up by 4 units.
- The maximum point is (3×1)+4=7 and the minimum point is (3×-1)+4=1.
- The period is $latex \frac{{2\pi}}{2}=\pi$
The graph looks like this:
EXAMPLE 2
- The following is the graph of the function $latex y=3\sin(2(x+3))-2$.
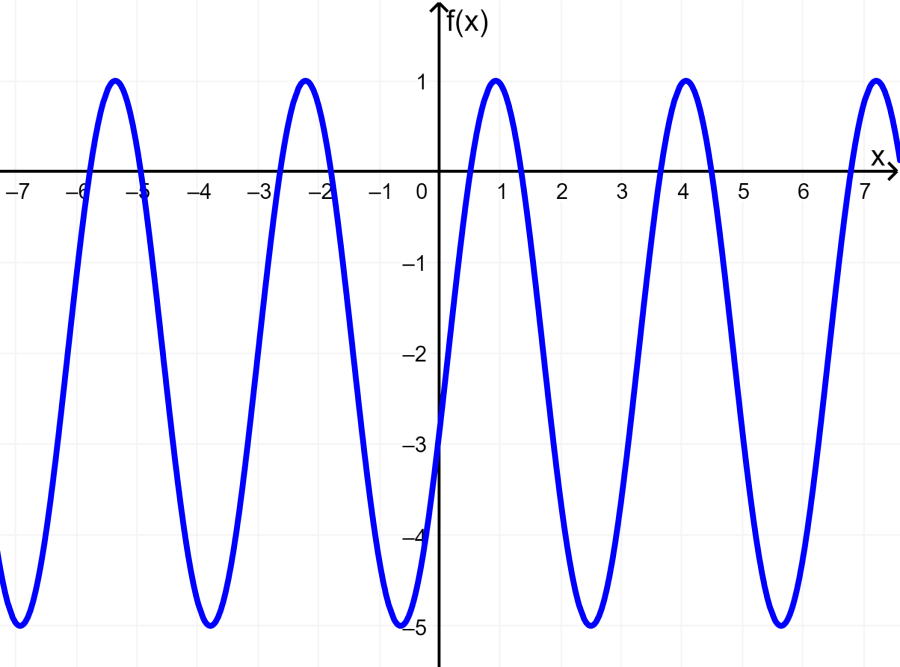
In this function, we have:
- Amplitude: $latex A=2$
- Period: $latex \text{periodo}=\frac{2\pi}{B}=\frac{2\pi}{2}=\pi$
- Phase: $latex C=-3$
- Vertical translation: $latex D=-2$
See also
Interested in learning more about graphs of functions? Take a look at these pages:

Jefferson Huera Guzman
Jefferson is the lead author and administrator of Neurochispas.com. The interactive Mathematics and Physics content that I have created has helped many students.