The velocity vs time graph, often abbreviated as a v-t graph, provides insights into the speed and direction of an object. It also allows us to obtain information about the acceleration of the object, and the displacement covered.
In this article, we will look at the nuances of these graphs, exploring different types of motion. By investigating the features of the graph such as positive and negative velocities, slopes, and the y-intercept, we can better understand the principles of motion.
What does a velocity vs time graph represent?
A velocity vs time graph represents a moving object’s changing velocity. This graph allows us to get a visual representation of the velocity of an object.
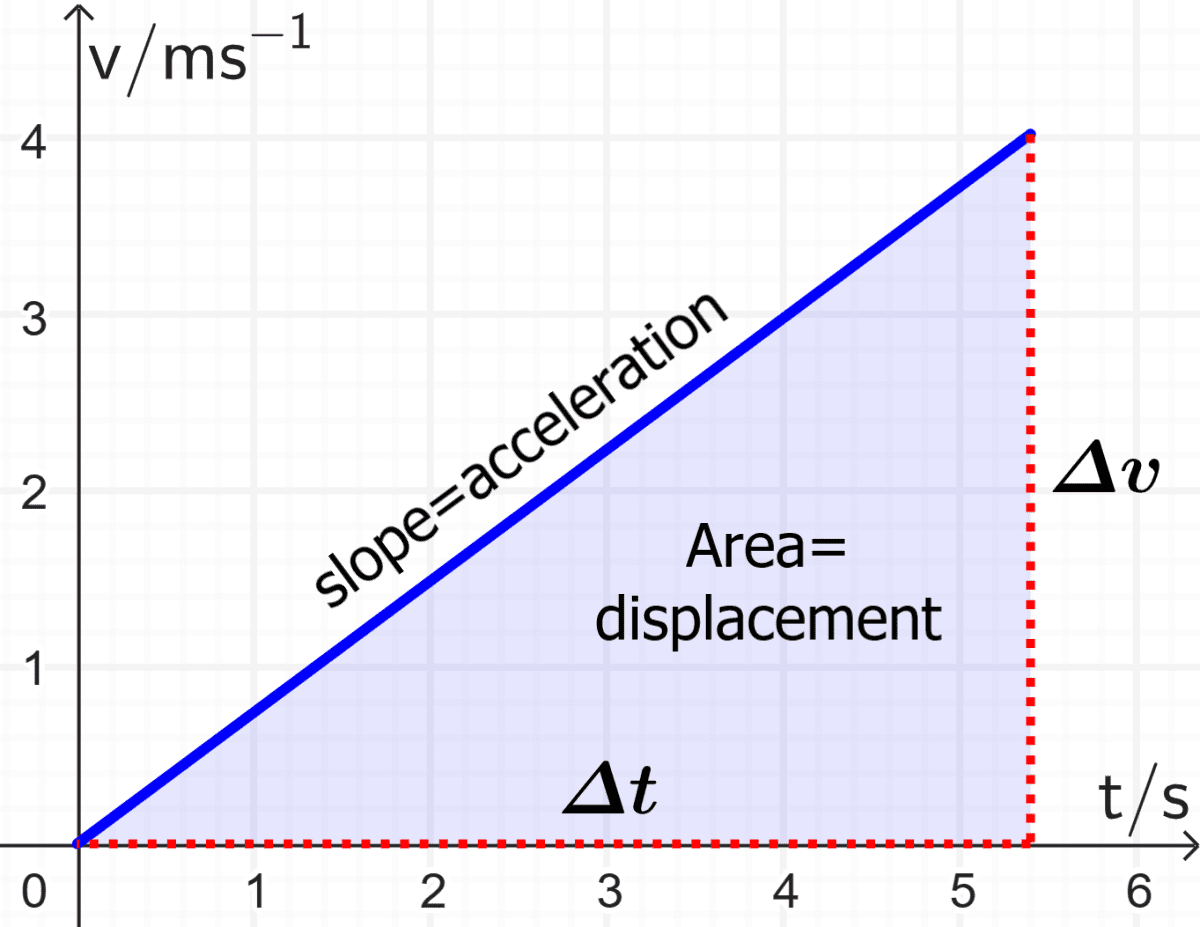
Some important features of this graph are that the slope represents the acceleration of the object and the area under the curve represents its displacement.
Finding acceleration from a velocity vs time graph
The slope of a velocity-time graph gives us information about the object’s acceleration. It provides key insights into the rate of change of an object’s velocity.
This graph tells us whether the object’s velocity is changing rapidly or slowly, or if it is remaining consistent over time. A steeper slope signifies a greater acceleration.
Let’s illustrate this with an example. The following graph delineates how a car’s velocity alters during a race. In order to determine the car’s acceleration during the initial section of the graph (where the line is straight), we can apply the concept of the slope.
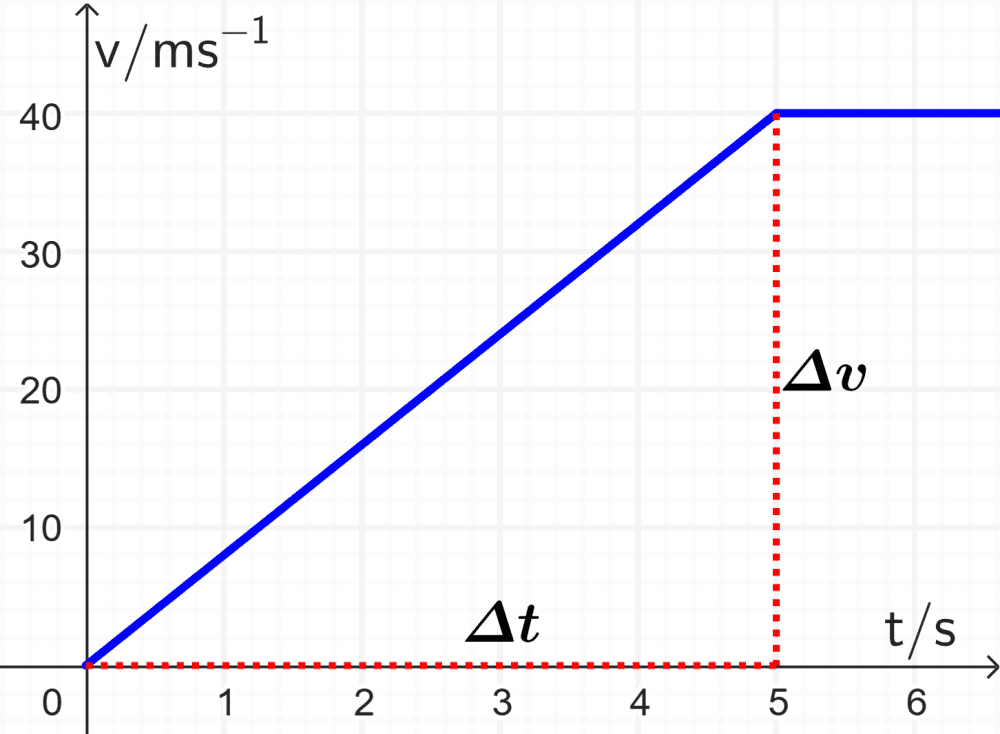
Using the triangle as demonstrated in the figure, the vertical side represents the change in velocity, and the horizontal side represents the time over which this change occurs. By calculating the ratio of these two (change in velocity divided by change in time), we obtain the gradient of the graph, which in turn gives us the acceleration of the car.
$$a=\frac{\Delta v}{\Delta t}$$
$$a=\frac{40-0}{5}$$
$$a=8~\text{ms}^{-2}$$
Finding displacement from a velocity vs time graph
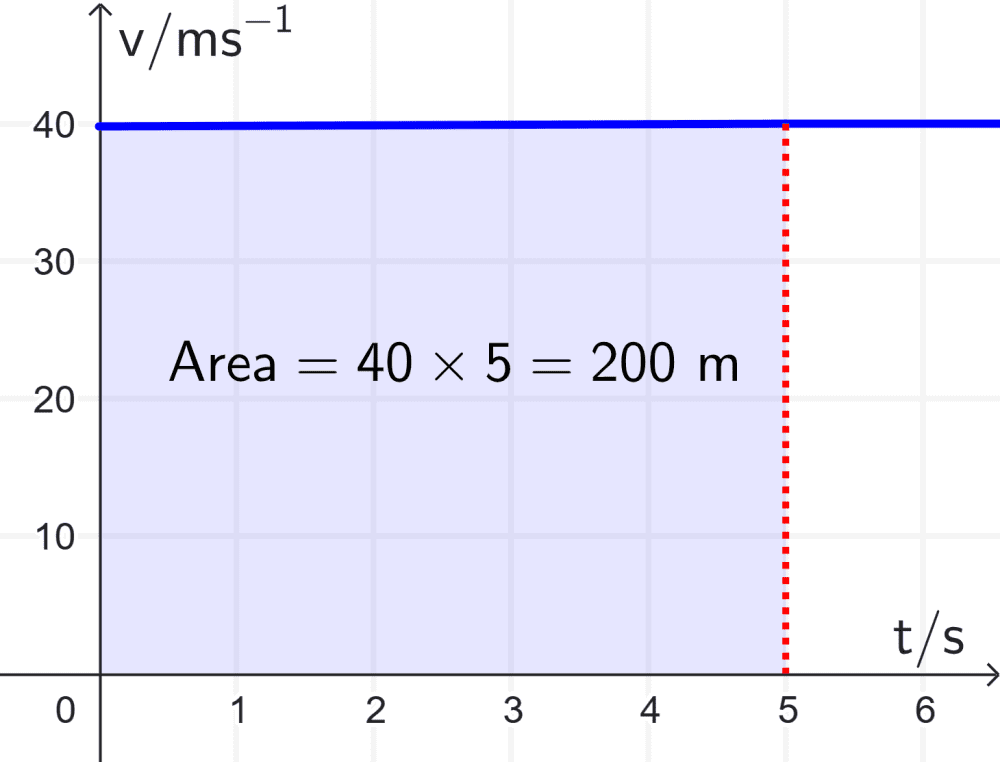
The displacement of a moving object can be found by determining the area under the velocity vs time graph.
We can easily understand why this is the case by considering a velocity vs time graph of an object with constant velocity. The displacement is $latex \text{velocity}\times\text{time}$, which is the area of the shaded rectangle:
Now, let’s look at an example with changing velocity. Similar to the previous case, the area under the graph gives the displacement.
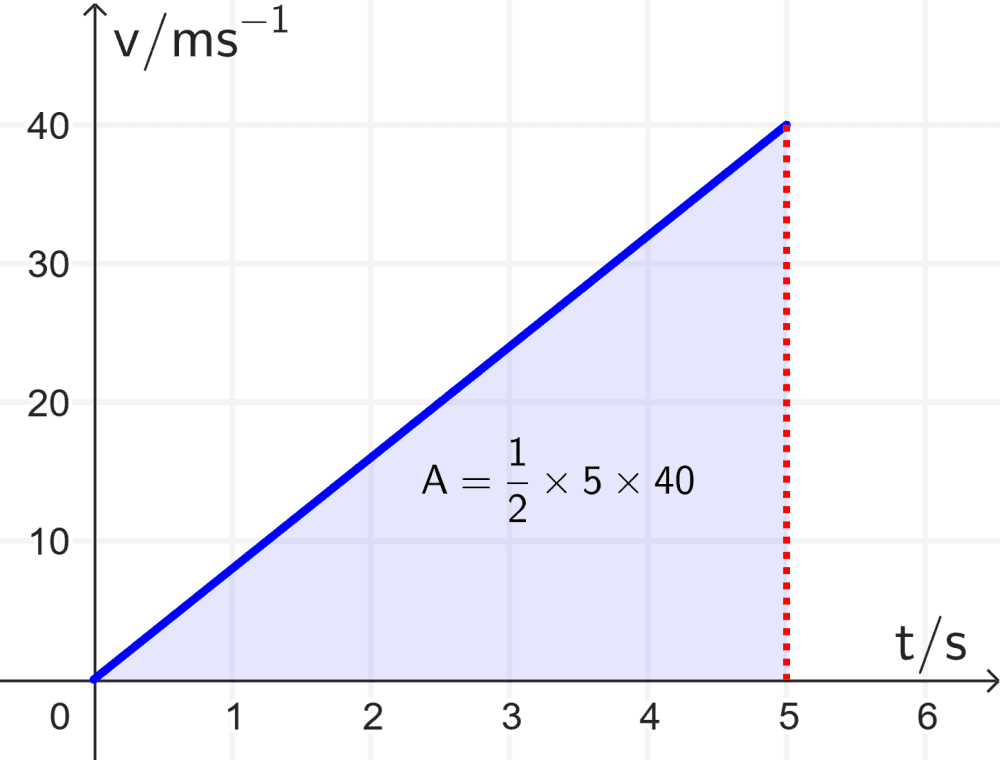
For this example, the area under the graph is a triangle, so we have:
$latex \text{displacement}=\frac{1}{2}\times \text{base}\times \text{height}$
$latex =\frac{1}{2}\times 5\times 40=100~\text{m}$
Different Types of Motion and their Graphs
Velocity vs time graphs display different characteristics depending on the type of motion.
Constant Acceleration
On a velocity vs time graph, constant acceleration is represented by a straight line. The slope of this line (which represents the acceleration) remains constant throughout.
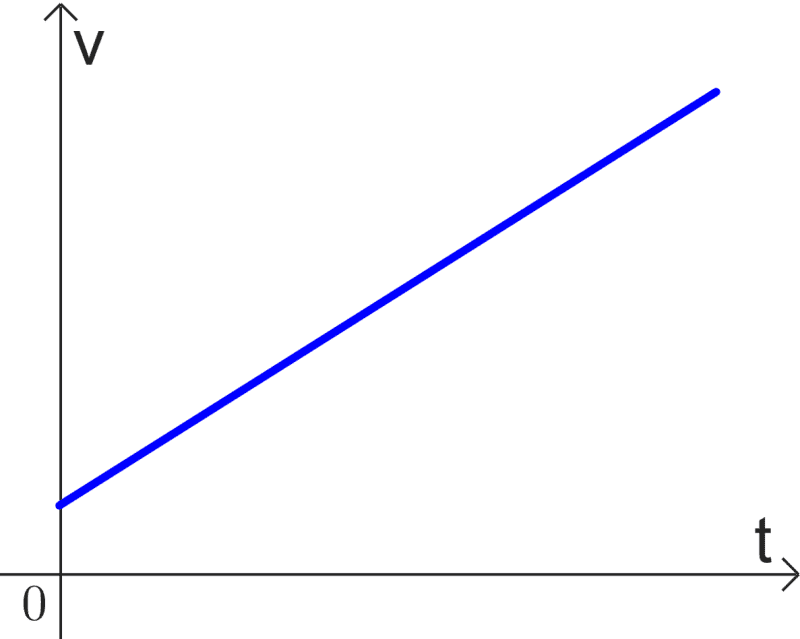
The slope shows the amount of acceleration of an object. The steeper the slope, the greater the acceleration.
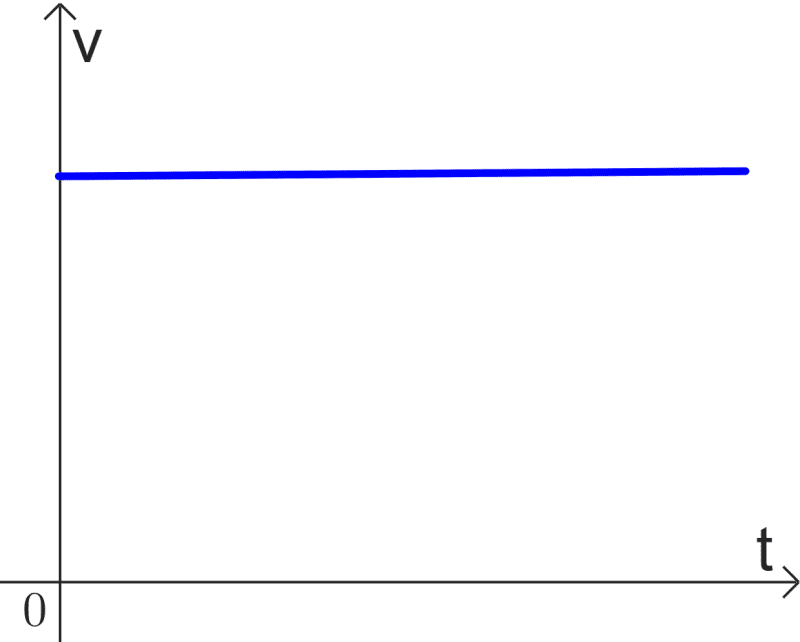
Constant Velocity
When the velocity is constant, the acceleration is $latex a=0$. The slope of a velocity vs time graph for an object with constant velocity is 0.
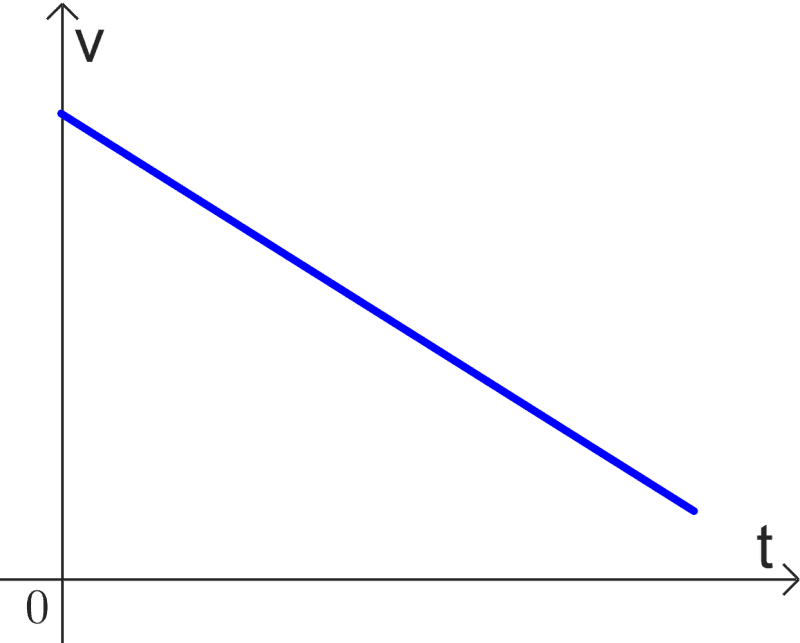
Negative acceleration
A negative slope represents deceleration or negative acceleration.
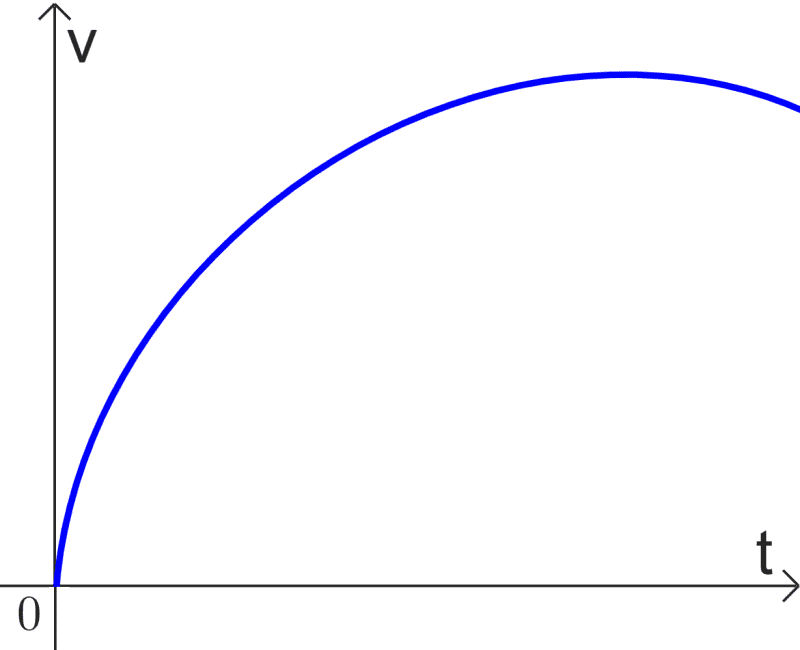
Changing acceleration
In a velocity vs time graph, changing acceleration is depicted by a curved line. The curve’s steepness changes, representing the changing acceleration.
Features of Velocity vs Time Graphs
Positive and Negative Velocity
- Positive velocity: On the graph, positive velocity is plotted above the time axis.
- Negative velocity: Movement in the opposite direction. This is plotted below the time axis.
- Zero velocity: Zero displacement represents an object at rest. On the graph, it’s depicted by points lying on the time axis.
Slope in Velocity vs Time Graphs
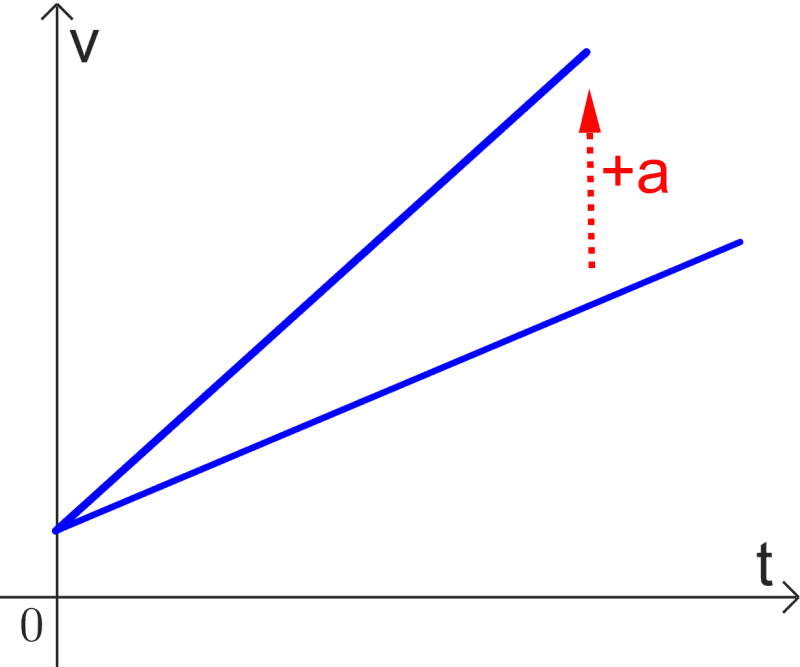
- Understanding slope: The slope of a line in a velocity vs time graph represents the acceleration of the object.
- Positive slope: A positive slope means an object is accelerating in the positive direction. A steeper slope denotes a higher acceleration.
- Negative slope: A negative slope indicates deceleration or acceleration in the negative direction. A steeper negative slope denotes a higher rate of deceleration.
- Zero slope: A zero slope means the object is moving at a constant velocity, i.e., it has zero acceleration.
Y-Intercept in Velocity vs Time Graphs
- Interpreting y-intercept: In a velocity vs time graph, the y-intercept represents the initial velocity of the object at time zero.
- Positive and negative y-intercept: A positive y-intercept means an initial velocity in the positive direction, while a negative y-intercept represents an initial velocity in the negative direction.
See also
Interested in learning more about acceleration and velocity? Take a look at these pages:

Jefferson Huera Guzman
Jefferson is the lead author and administrator of Neurochispas.com. The interactive Mathematics and Physics content that I have created has helped many students.