In physics, visual representations play a crucial role in explaining complex concepts. One such vital representation is the displacement vs time graph. This graphical tool not only simplifies the understanding of motion, but also provides profound insights into the nature and characteristics of moving objects.
This article delves into the concept of displacement vs time graphs, explaining its core aspects, features, and implications in various types of motion.
What does a displacement vs time graph represent?
A displacement vs time graph represents a moving object’s changing position. By graphing the object’s displacement against time, we are able to get a visual representation of the object’s motion.
An important aspect to note is that the gradient, or slope, of the graph, corresponds to the object’s velocity, as shown in the diagram:
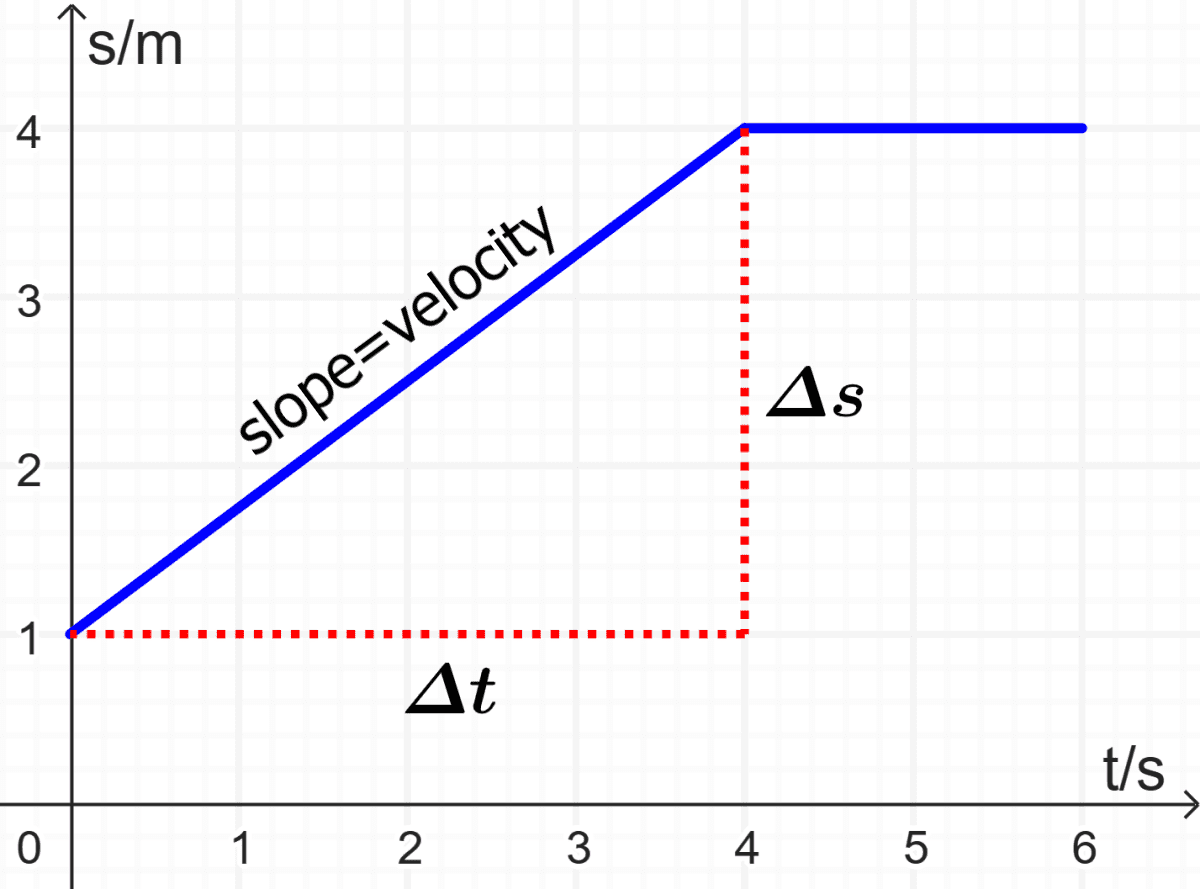
In this graph, a steeper slope signifies a greater velocity. In addition, a displacement–time graph provides insights beyond just speed; it can also tell us the direction in which an object is moving. If the gradient is negative, this implies that the object’s velocity is negative too, meaning that the object is moving backwards.
Example of a displacement vs time graph
Let’s consider a car moving along a straight road. We note its displacement at various times, as shown in the following table. By using this data, we can plot a displacement–time graph. This graph then becomes a tool through which we can deduce the car’s velocity.
| Displacement (m) | 10 | 20 | 30 | 40 | 40 | 40 |
| Time (s) | 0 | 1 | 2 | 3 | 4 | 5 |
Let’s look at the data first to find patterns. We see that the displacement increases steadily until 3 s, and then becomes constant. This means that the car has a steady velocity at first and then stops.
Now, we plot the displacement vs time graph:
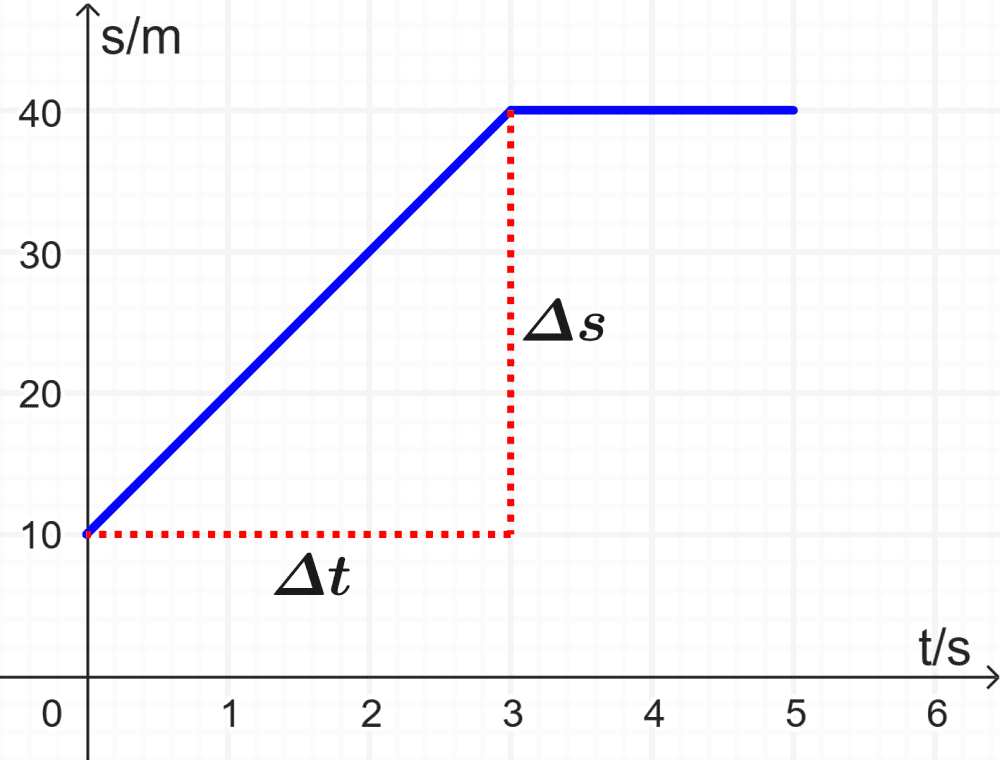
Let’s suppose we want to find the velocity of the car during the first 3 seconds. We can do this by finding the gradient of the graph.
The gradient of the graph is equal to the change in displacement ($latex \Delta s$) divided by the change in time ($latex \Delta t$):
$$v=\frac{\Delta s}{\Delta t}$$
$$v=\frac{(40-10)}{(3-0)}$$
$$v=\frac{30}{3}=10~\text{ms}^{-1}$$
Different Types of Motion and their Graphs
Depending on the types of motion, the displacement vs time graphs will display different characteristics. Understanding these types of motion and their graphical representations allows us to interpret the behavior of moving objects accurately.
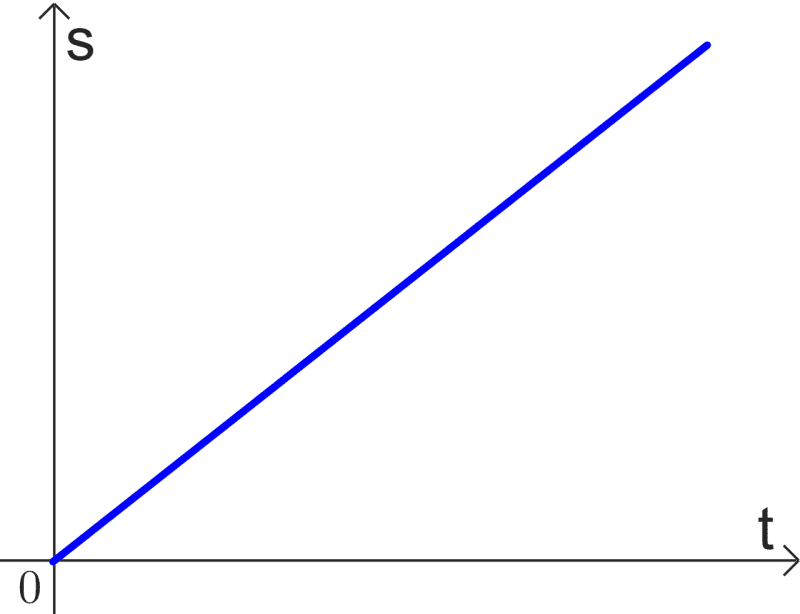
Constant Velocity Motion
This type of motion occurs when an object moves at a steady speed with zero acceleration. On a displacement vs time graph, constant velocity is represented by a straight line. The slope of this line (which represents the velocity) remains constant throughout.
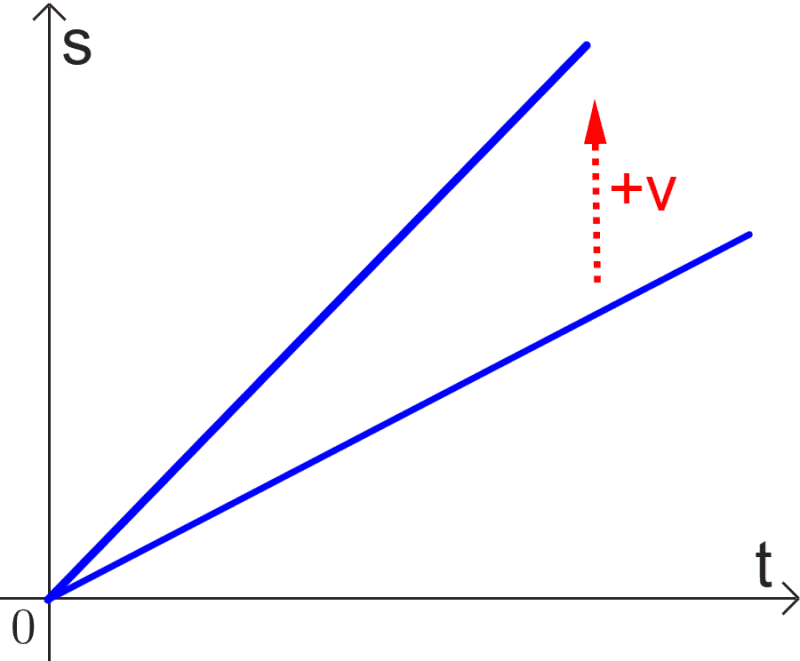
For motion of two or more objects, the slope shows which object is moving faster. The steeper the slope, the greater the velocity.
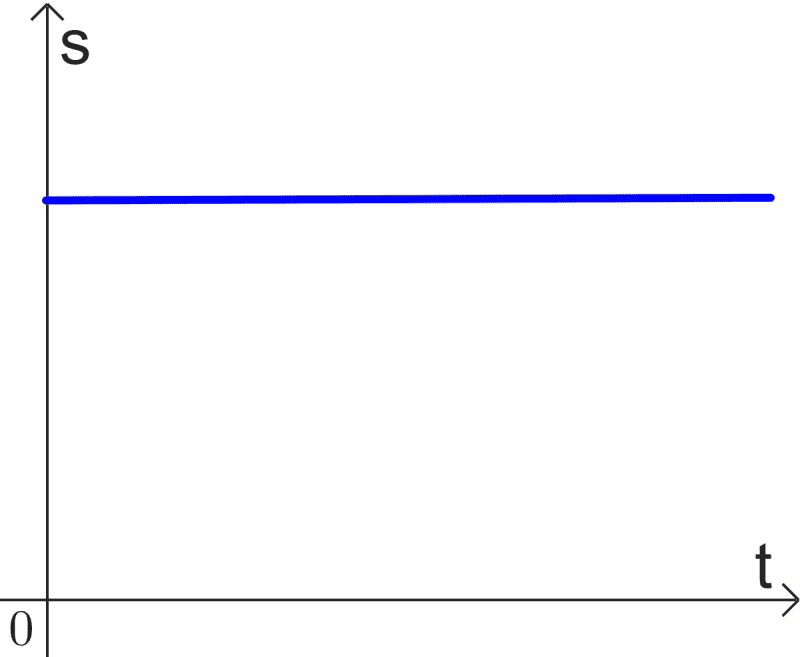
Stationary Object
When an object is stationary, the displacement is not changing, so the velocity is $latex v=0$. The slope of a displacement vs time graph for a stationary object is 0.
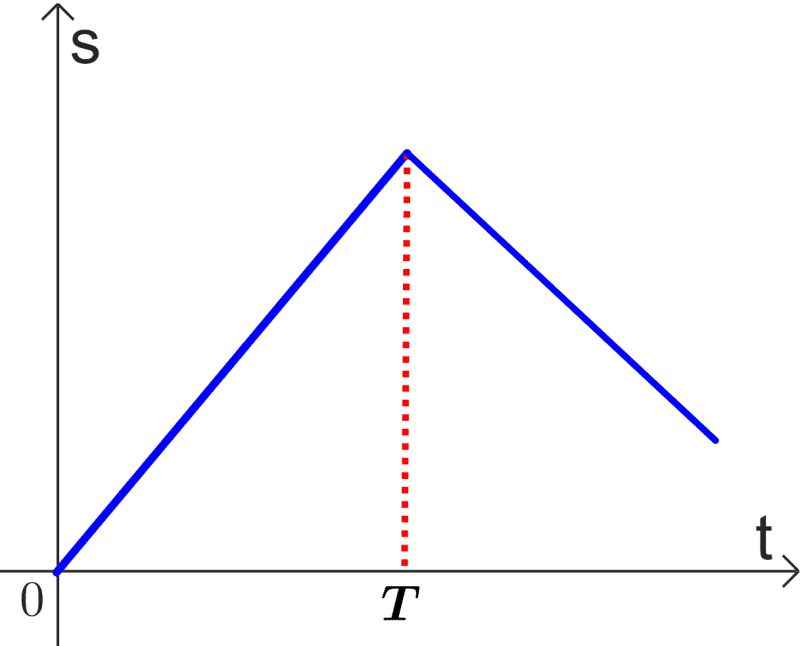
Negative velocity
When an object has negative velocity, its displacement decreases. The slope of this graph is negative. In the following diagram, the velocity is negative after time $latex T$.
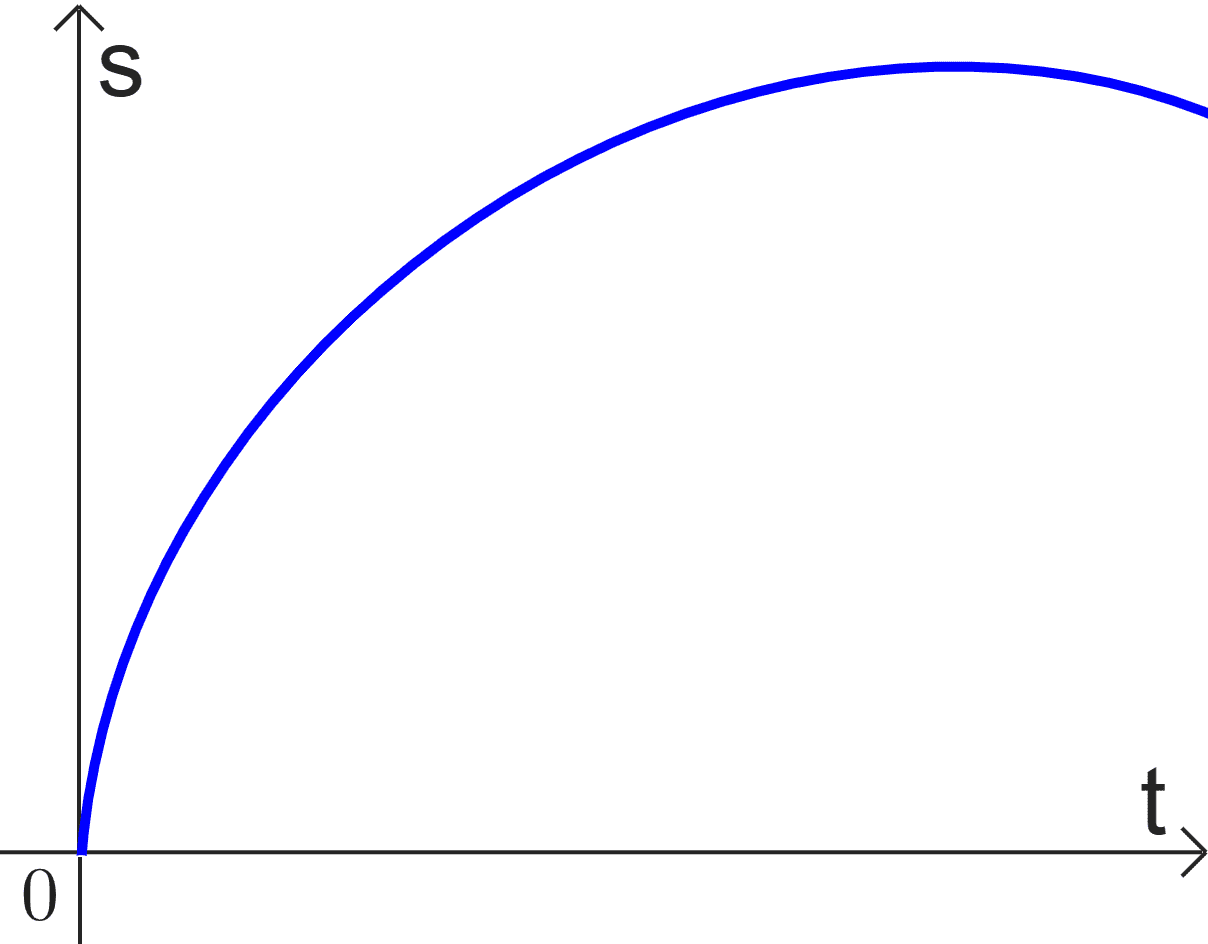
Accelerated Motion
This type of motion happens when an object’s velocity changes over time. In a displacement vs time graph, accelerated motion is depicted by a curved line. The curve’s steepness changes, representing the changing velocity.
Features of Displacement vs Time Graphs
Positive and Negative Displacement
- Positive displacement: On the graph, it is denoted by points plotted above the time axis.
- Negative displacement: This indicates movement in the direction opposite to the chosen positive direction. On the graph, it is represented by points plotted below the time axis.
- Zero displacement: Zero displacement can either mean the object is stationary or it has returned to its starting position. On the graph, it’s depicted by points lying on the time axis.
Slope in Displacement vs Time Graphs
- Understanding slope: The slope of a line in a displacement vs time graph represents the velocity of the object.
- Positive slope: A positive slope indicates an object is moving in the positive direction. A steeper slope represents a higher velocity.
- Negative slope: A negative slope means motion in the negative direction. A steeper negative slope denotes a higher speed but in the opposite direction.
- Zero slope: A zero slope means the object is not moving, i.e., it has zero velocity.
Y-Intercept in Displacement vs Time Graphs
- Interpreting y-intercept: In a displacement vs time graph, the y-intercept represents the initial displacement of the object at time zero.
- Positive and negative y-intercept: A positive y-intercept indicates an initial displacement in the positive direction, while a negative y-intercept suggests an initial displacement in the negative direction.
See also
Interested in learning more about displacement and velocity? Take a look at these pages:

Jefferson Huera Guzman
Jefferson is the lead author and administrator of Neurochispas.com. The interactive Mathematics and Physics content that I have created has helped many students.