A linear function is defined as a function that has one or more variables without exponents. Linear functions produce straight lines when graphed. Here, we are going to do a brief review of linear functions. We will look at how to graph linear functions and how to find their equations.
In addition, we will see several examples with answers to put what we have learned into practice.
Summary of linear functions
A linear function is a function that forms a straight line when graphed. These types of functions are generally polynomial functions, which have a maximum degree of 1. A linear function has a dependent variable and an independent variable. The independent variable is x and the dependent variable is y.
Linear functions have the following general form:
$latex y=f(x)=mx+b$
where:
- b is the constant term or the y-intercept. This is the value of the dependent variable when we have $latex x=0$.
- m is the coefficient of the independent variable. It is also known as the slope and determines the steepness of the line.
Graphing a linear function
To graph a linear function, we follow the following steps:
Step 1: Find two points that satisfy the function.
Step 2: Plot those points on the Cartesian plane.
Step 3: Connect those points with a straight line.
Finding the equation of a line
The easiest way to find the equation of a line is to write it in the form $latex y=mx+b$.
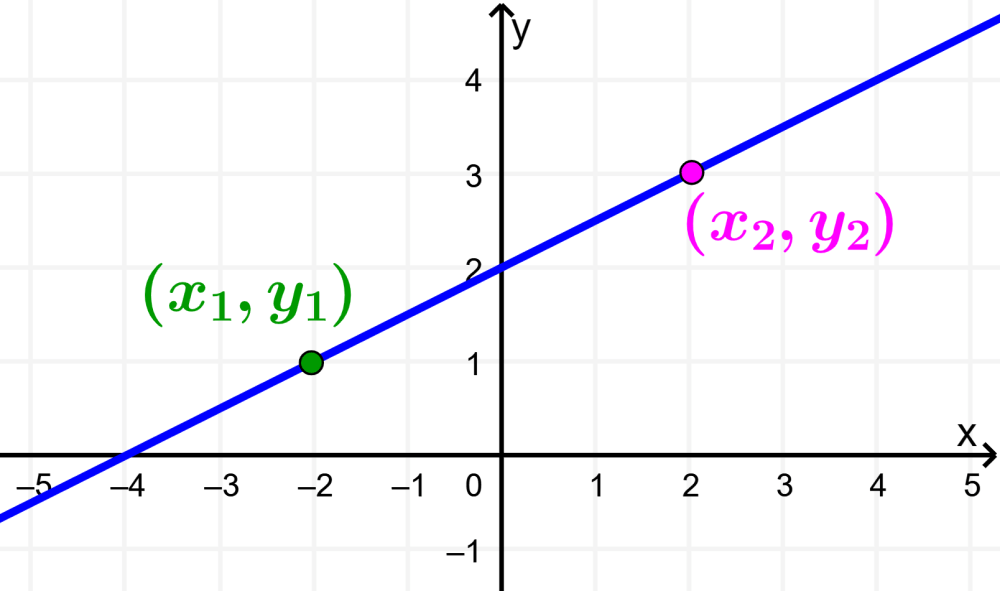
If we have two points in a function, $latex (x_{1}, ~ y_{1})$ and $latex (x_{2}, ~ y_{2})$, the slope can be found using the formula:
$latex m = \frac{y_{2}-y_{1}}{x_{2}-x_{1}}$
The y-intercept is found by substituting in the slope and using any point to solve for b.
Examples with answers of linear function problems
The following examples use various aspects of linear functions. Each example has its respective solution, so you can look at the reasoning used to find the answer. Try to solve the exercises yourself before looking at the answer.
EXAMPLE 1
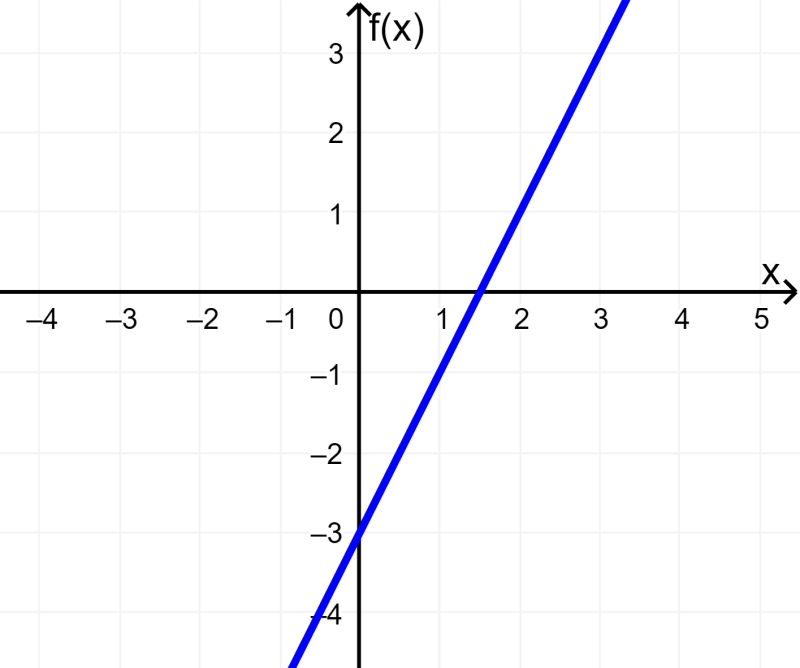
Does the following graph represent a linear function?
Solution
We can easily determine that the graph does represent a linear function since it is a straight line.
The graph represents the function $latex f(x)=2x-3$.
EXAMPLE 2
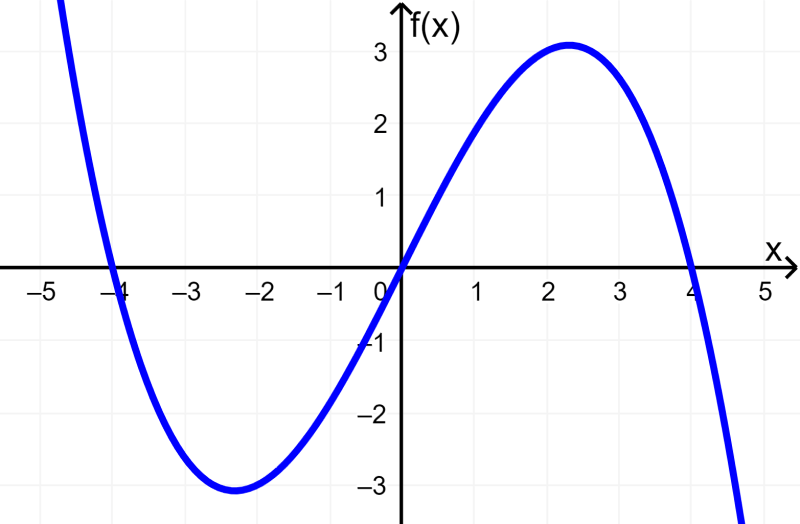
Is the following graph a linear function?
Solution
This graph is not a straight line, therefore it does not represent a linear function.
The graph represents the function $latex f(x)=2x-\frac{1}{8}{{x}^3}$.
EXAMPLE 3
Does the following graph represent a linear function?
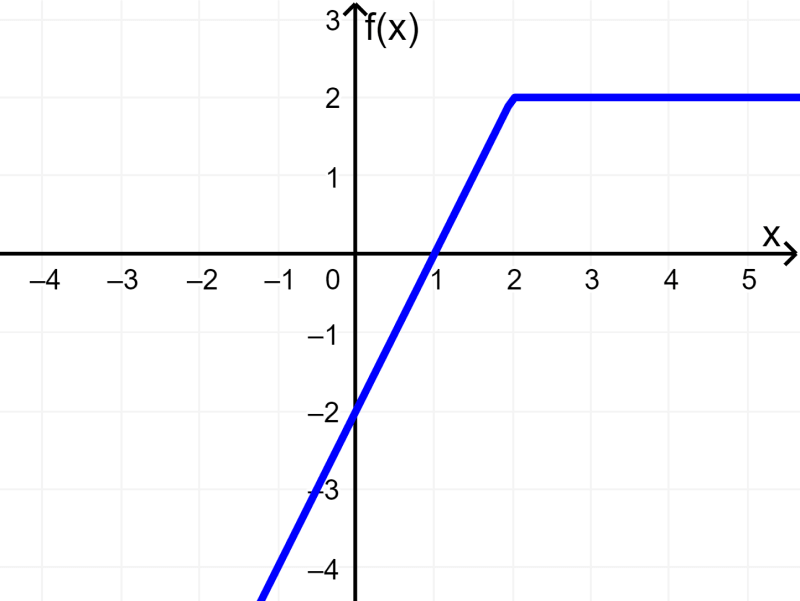
Solution
This function appears to be linear, however, this function is made up of segments that are straight lines. This is a piecewise-defined function.
The graph represents the following function:
EXAMPLE 4
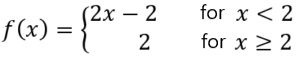
Graph the linear function $latex f(x)=2x+1$.
Solution
One way to graph this function is to use two points that lie on the line and then draw a line that passes through the points. We can use $latex x=0$ and $latex x=1$.
For $latex x=0$, we have $latex f(0)=2(0)+1=1$. Thus, we have the point (0, 1).
For $latex x=1$, we have $latex f(1)=2(1)+1=3$. Thus, we have the point (1, 3).
Plotting those points and drawing a line, we have:
EXAMPLE 5
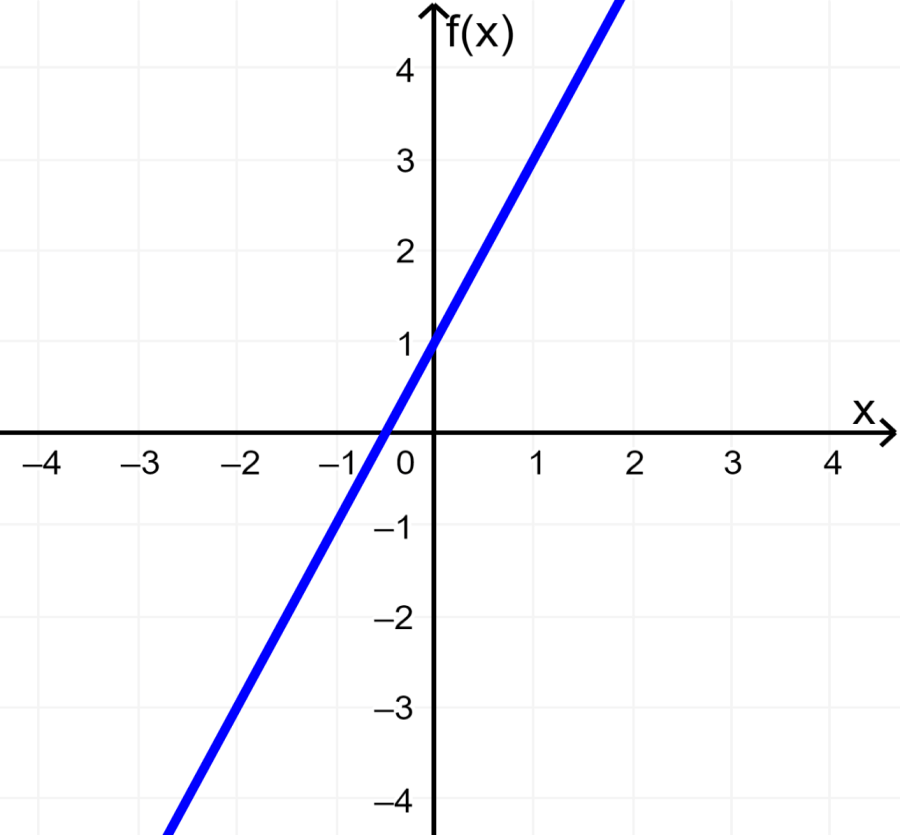
Graph the linear function $latex f(x) =-3x+2$.
Solution
Again, we can find two points that lie on the line. Therefore, we can use the values $latex x=-1$ and $latex x=1$.
When we use $latex x=-1$, we have $latex f(-1)=-3(-1)+2=5$. Thus, we have the point (-1, 5).
When we use $latex x=-1$, we have $latex f(1)=-3(1)+2=-1$. Thus, we have the point (1, -1).
By graphing these points and drawing a line, we have:
EXAMPLE 6
Find the linear function that passes through the points (-2, -3) and (3, 2).
Solution
To find the equation of a linear function, we can use the form $latex y=mx+b$, where m is the slope and b is the y-intercept.
The slope can be found using the formula $latex m=\frac{y_{2}-y_{1}}{x_{2}-x_{1}}$. Therefore, replacing the values with the given two points, we have:
$latex m=\frac{2-(-3)}{3-(-2)}$
$latex =\frac{5}{5}=1$
To find b, we plug in $latex m = 1$ and use any of the points. We are going to use the point (3, 2):
$latex y=mx+b$
$latex 2=1(3)+b$
$latex b=-1$
Thus, the linear function is $latex f(x)=x-1$.
EXAMPLE 7
Find the linear function that passes through the points (-1, 4) and (2, -2).
Solution
Again, we can use the form $latex y=mx+b$, where m is the slope and b is the y-intercept.
Therefore, we use $latex m=\frac{y_{2}-y_{1}}{x_{2}-x_{1}}$ to find the slope with the given points:
$latex m=\frac{-2-4}{2-(-1)}$
$latex =\frac{-6}{3}=-2$
We plug in $latex m=-2$ to find the y-intercept, b. We are going to use the point (2, -2):
$latex y=mx+b$
$latex -2=-2(2)+b$
$latex b=2$
Thus, the linear function is $latex f(x)=-2x+2$.
Linear function problems – Practice
Test your knowledge of linear functions with the following problems. Choose an answer and check it to see if you selected the correct one. Use the solved examples above if you need help.
See also
Interested in learning more about linear functions? Take a look at these pages:

Jefferson Huera Guzman
Jefferson is the lead author and administrator of Neurochispas.com. The interactive Mathematics and Physics content that I have created has helped many students.