The graph of cosine has the main characteristic that it is periodic with a period of 2π. This means that the function extends to both sides and has a uniform shape. Therefore, the function can have any value of x, which means that the domain is equal to all real numbers.
On the other hand, the values of y go from -1 to 1, so the range of the function is all the real numbers that are inside -1 and 1. Using the general form of the cosine, we can change different parameters, such as amplitude, phase, period and we can change the shape of the graph.
TRIGONOMETRY
Relevant for…
Learning about the graph of the cosine function with examples.
TRIGONOMETRY
Relevant for…
Learning about the graph of the cosine function with examples.
Graph of the basic cosine function
To graph the cosine function, we plot the angle along the horizontal x-axis, and for each angle, we place the cosine of that angle on the vertical y-axis. The result of this is a curve ranging from +1 to -1. The curves that follow this figure are called sinusoids.
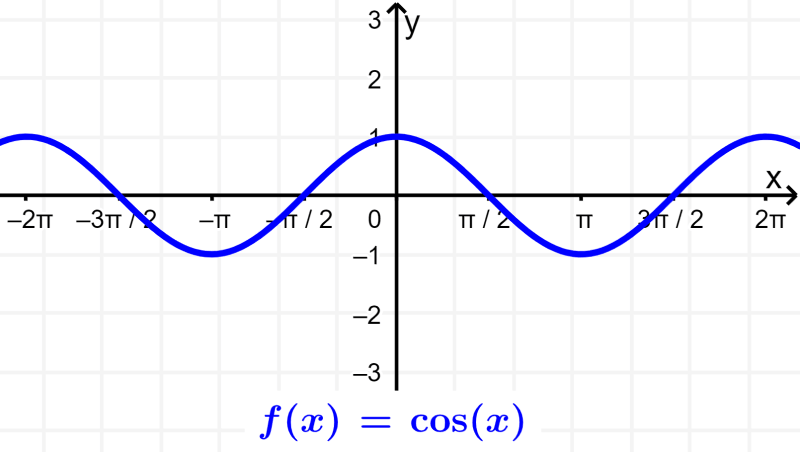
The cosine function is a periodic function. This means that the function repeats itself at regular intervals. In the basic cosine function, the period is 2π. The cosine function is also symmetrical about the y-axis. This means that the cosine function is an even function.
Domain of the cosine function
Since the function is periodic with a period of 2π or 360°, we can find the cosine of any angle no matter how large it is. For example, the results of the cosine of the angles 2π, 4π, and 6π are equivalent. Therefore, the domain of the cosine function is equal to all real numbers.
Range of the cosine function
Looking at the graph of the basic cosine function, we can see that the values of y go from -1 to 1. The cosine curve never leaves these values. This means that the range of the cosine function is all real numbers between 1 and -1.
Graphs of variations of the cosine function
The basic cosine function can have variations that make the graph look different. The general form of the cosine function is:
$latex y=A~\cos(Bx-C)+D$
The different parameters in this general form allow changes to be made to the shape of the function graph. Each parameter affects different aspects of the graph.
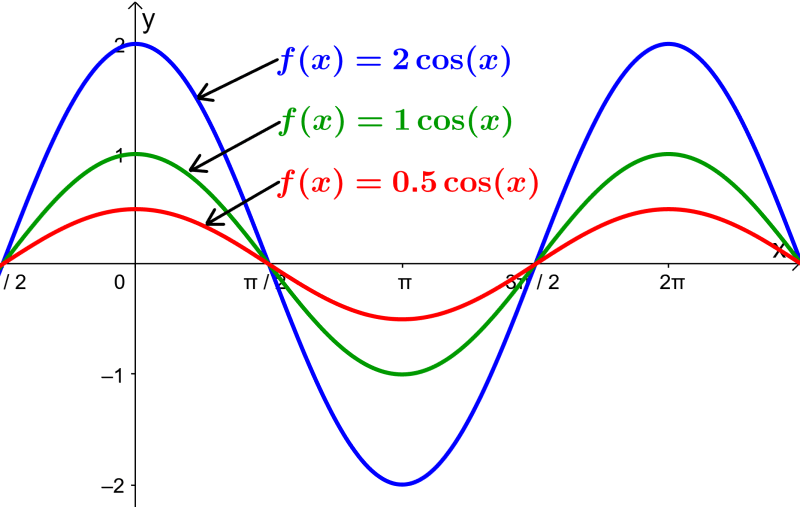
Determine the amplitude of the cosine function
The amplitude represents the vertical stretch or the height of the function. The amplitude is the distance from the middle line of the graph to the maximum or minimum point. Amplitude is measured as an absolute value. In the case of the basic cosine function, the midline is the x-axis and the amplitude is 1.
In the general form of the cosine function, we can find the amplitude using |A|. For example, the amplitude of $latex y = 3 \cos(x)$ is 3.
Determine the period of the cosine function
The period represents the interval after which the function begins to repeat. The period of the basic cosine function is 2π.
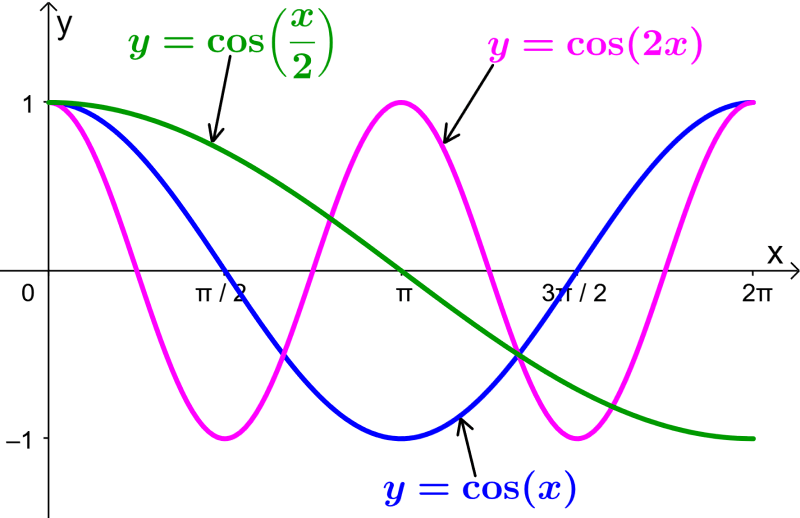
In general form, we use the parameter B and the relation $latex P = \frac{2 \pi}{|B|}$ to calculate the period of the function. When the value of B is greater than 1, the period is less than 2π and the function is horizontally compressed.
When the value of B is less than 1, the period is greater than 2π and the function is stretched horizontally.
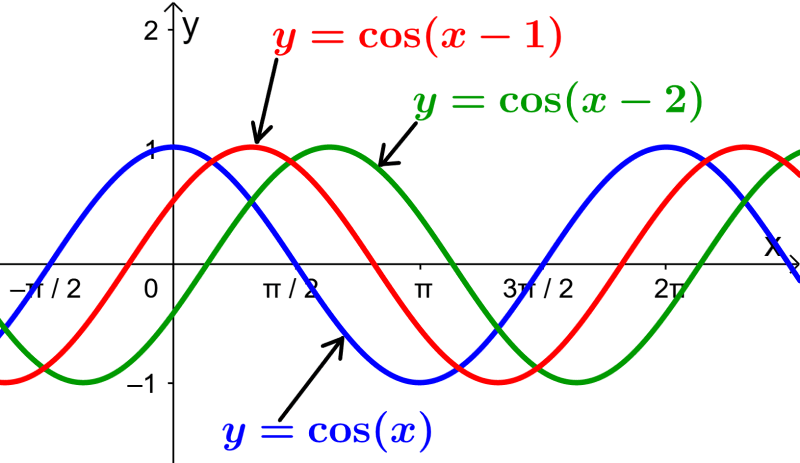
Determine the phase of the cosine function
The phase represents the horizontal shift of the cosine function. By definition, the basic cosine function has a phase or horizontal offset of 0.
To find the phase in general form, we rewrite it as follows: $latex y = A ~ \cos(B(x- \frac{C}{B})+D$. In this form, the phase is equal to the value $latex \frac{C}{B}$. If we have $latex C> 0$, the graph of the cosine is shifted to the right and if $latex C <0$, the graph is shifted to the left.
Determine the vertical translation of the cosine function
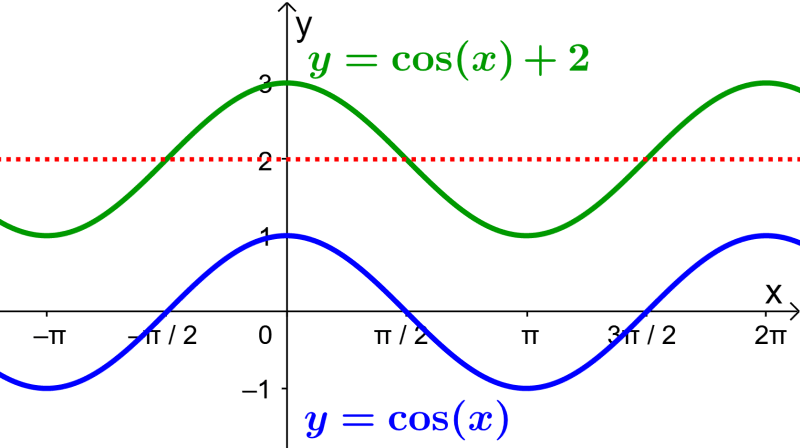
The value D in the general form corresponds to the vertical displacement of the middle line of the graph. A positive value of D represents an upward shift and a negative value of D represents a downward shift. The function $latex y = \cos(x) + D$ has its middle line at $latex y = D$.
Examples with answers of the graph of cosine
The following examples can be used to practice what you have learned about the graphs of the cosine function. Each example has its respective solution, but try to solve the problems yourself before looking at the answer.
EXAMPLE 1
What is the graph of the function $latex y=2 \cos(2x) +1$?
Solution
To graph a cosine function that has different parameters, we use the graph of the basic cosine function and apply the different transformations depending on the different parameters. Looking at the given equation, we see that we have:
- Amplitude: $latex |A|=2$. The graph will be twice as high.
- Period: $latex P =\frac{2 \pi}{|B|} = \frac{2 \pi}{2}= \pi$. The graph will be compressed by a factor of 2 horizontally.
- Phase: $latex \frac{C}{B}=0$. There is no horizontal translation.
- Vertical translation: $latex D=1$. The middle line is located at $latex y=1$.
Using this, the graph of this function is:
EXAMPLE 2
What is the graph of the function $latex y=3 \cos (\frac{1}{3} x-1) -2$?
Solution
We graph the function based on the basic cosine function and by applying the appropriate transformations. Looking at the given equation, we see that we have:
- Amplitude: $latex |A|=3$. The graph will be three times as high.
- Period: $latex P=\frac{2 \pi}{|B|}=\frac{2\pi}{\frac{1}{3}}=6 \pi$. The graph will be stretched by a factor of 3 horizontally.
- Phase: $latex \frac{C}{B} = \frac{1}{\frac{1}{3}}=3$. The graph is translated 3 units to the right.
- Vertical translation: $latex D = -2$. The middle line is located at $latex y=-2$.
Using this, the graph of this function is:
EXAMPLE 3
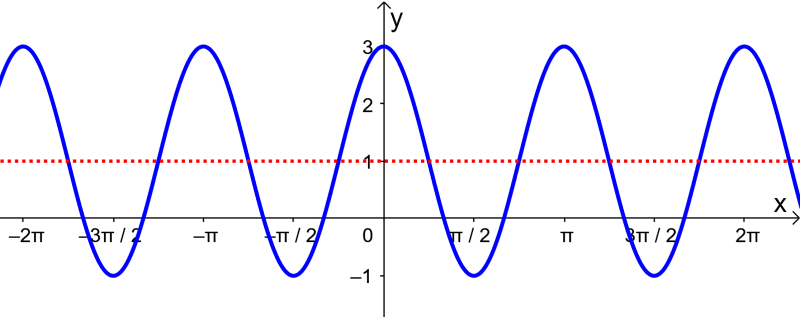
What is the equation of the following cosine function?
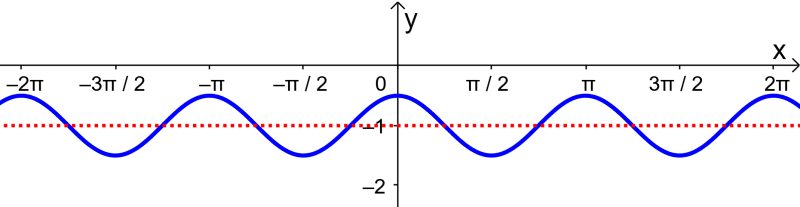
Solution
We observe the following characteristics in the graph of the function:
- The graph is half the height of the original graph. This means that $latex A = \frac{1}{2}$.
- The period of the graph is π, which means that the parameter B must be 2.
- There is no horizontal translation, so C must be 0.
- The middle line is $latex y=-1$, so D equals -1.
Using this, we conclude that the equation of this function is:
$latex y=\frac{1}{2} \cos(2x) -1$
EXAMPLE 4
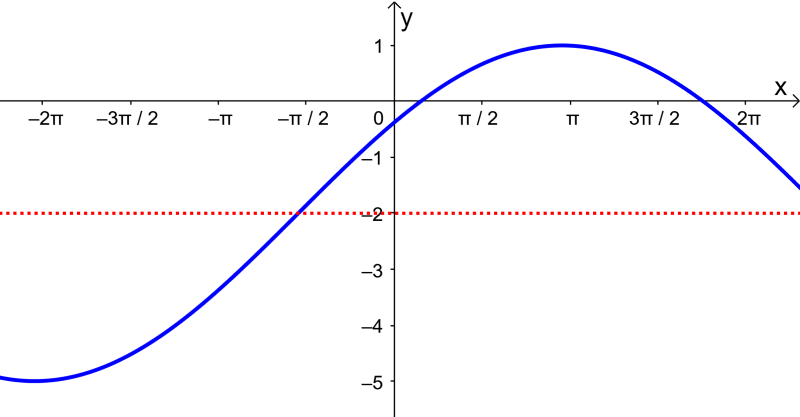
What is the equation of the following cosine function?
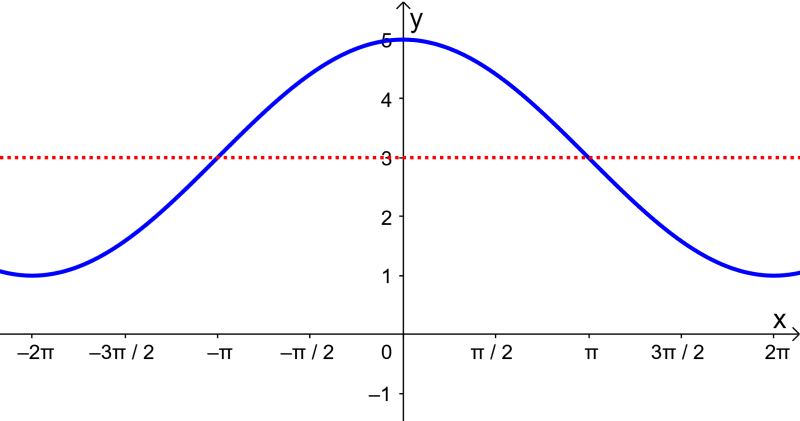
Solution
We can extract the following information from the graph:
- The distance from the middle line to the highest point is 2. This means that $latex A=2$.
- The period of the graph is 4π, so we have $latex B=\frac{1}{2}$.
- There is no horizontal translation, so C must be 0.
- The middle line is $latex y=3$, so D equals 3.
Using this information, we can determine that the equation of the function is:
$latex y = 2 \cos(\frac{1}{2} x) +3$
See also
Interested in learning more about the cosine of an angle? Take a look at these pages:

Jefferson Huera Guzman
Jefferson is the lead author and administrator of Neurochispas.com. The interactive Mathematics and Physics content that I have created has helped many students.