There are several transformations of trigonometric functions with which we can switch to the graphs of the standard trigonometric functions. We can make changes in the amplitude, in the period, in the phase of the function. We can also perform vertical translations and produce reflections from the graphs.
Here, we will look at these transformations of trigonometric functions in detail along with some examples to visualize the effect of the transformations.
ALGEBRA
Relevant for…
Learning to perform transformations of trigonometric functions.
ALGEBRA
Relevant for…
Learning to perform transformations of trigonometric functions.
Amplitude of trigonometric functions
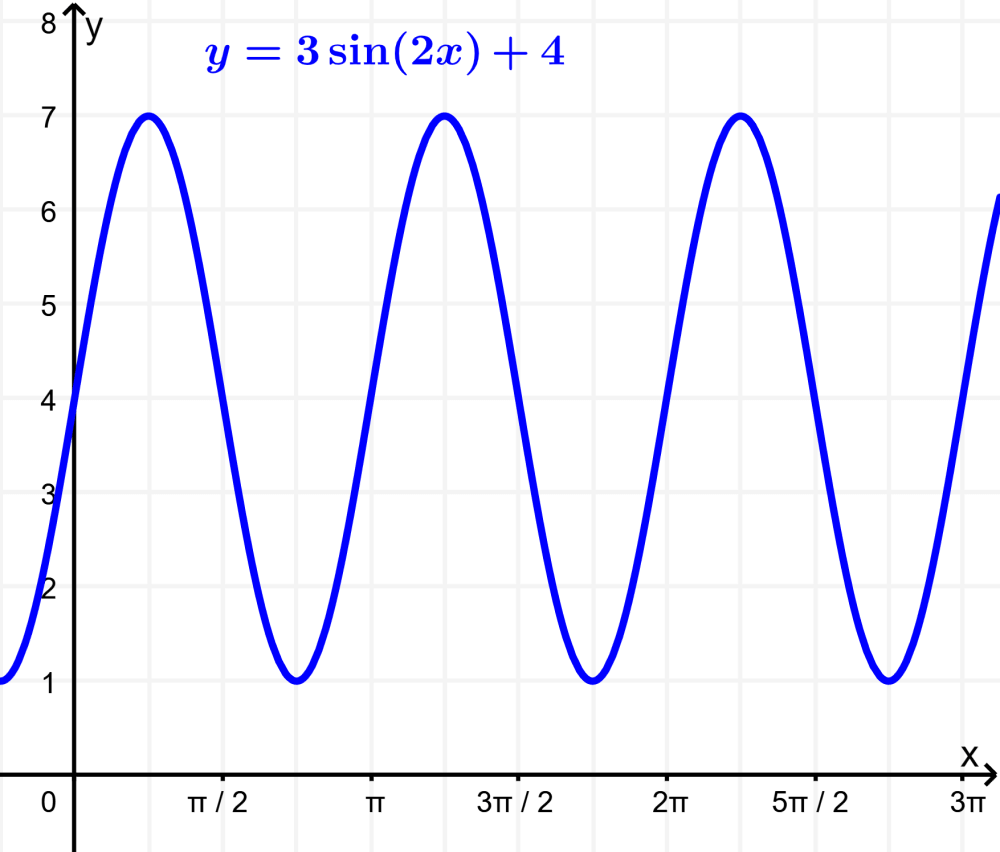
The amplitude of a trigonometric function is the maximum distance on the graph of that function. The amplitude is the distance from the average value of the curve to its maximum or minimum value.
In the case of the sine and cosine functions, the amplitude is the value of the leading coefficient of the function. We can change the amplitude of these functions by multiplying the function by a constant A.
For example, if the function is $latex y = A \sin(x)$, then the amplitude is |A|.
In the case of the tangent, cosecant, secant, and cotangent functions, the amplitude will be infinitely large regardless of the value of A.
Period of trigonometric functions
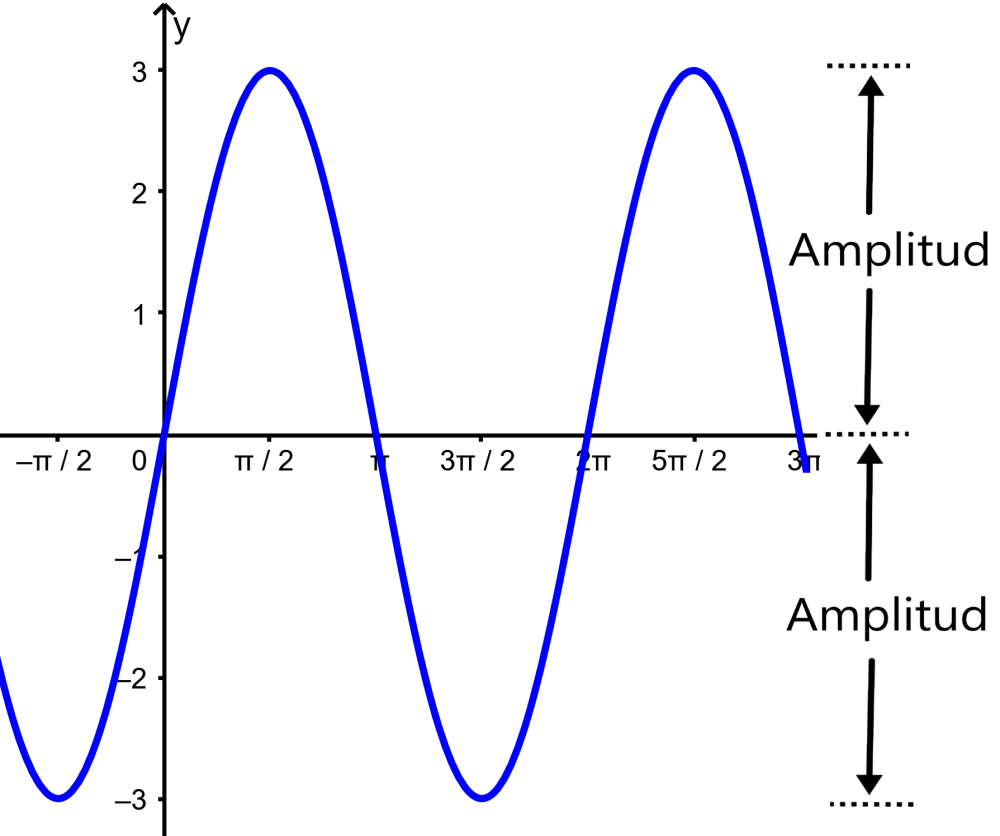
The period of a trigonometric function is the length of one cycle. That is, the period is the displacement of x in which the graph of the function begins to repeat. For example, consider the function $latex y=\sin(x)$:
The value $latex x=2\pi$ is the point at which the graph begins to repeat.
The coefficient of x is the constant that determines the period. The general form is $latex y=\sin(Bx)$, where B determines the period. For the sine, cosine, secant, and cosecant functions, the period is $latex 2\pi$ and we can change the period according to the formula:
$latex \text{period} =\frac{\text{original period}}{|B|}$
When |B| is greater than 1, the new period is smaller than the original, so the function appears to have horizontal compression. When |B| is less than 1, the function appears to have a horizontal stretch.
The tangent and cotangent functions have a period of $latex \pi$.
Phase of trigonometric functions
The phase of a trigonometric function refers to the horizontal translation to the right of the graph of the function.
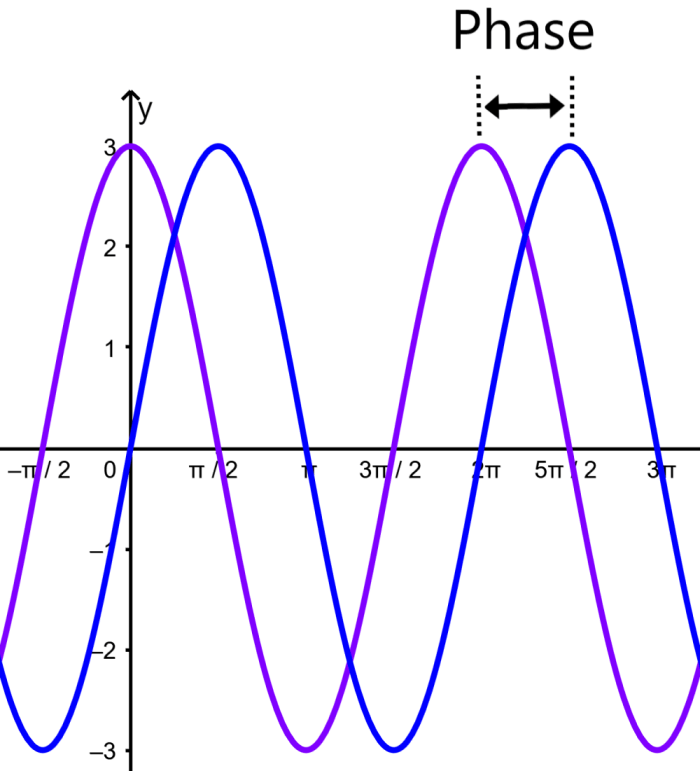
The general form of the trigonometric function is $latex y=A\sin B(x-C)$, where A is the amplitude, B is the period, and C is the phase.
The graph of $latex y = \sin(x)$ can be translated to the right or to the left. If C is positive, the translation is to the right and if C is negative, the translation is to the left.
Vertical translation
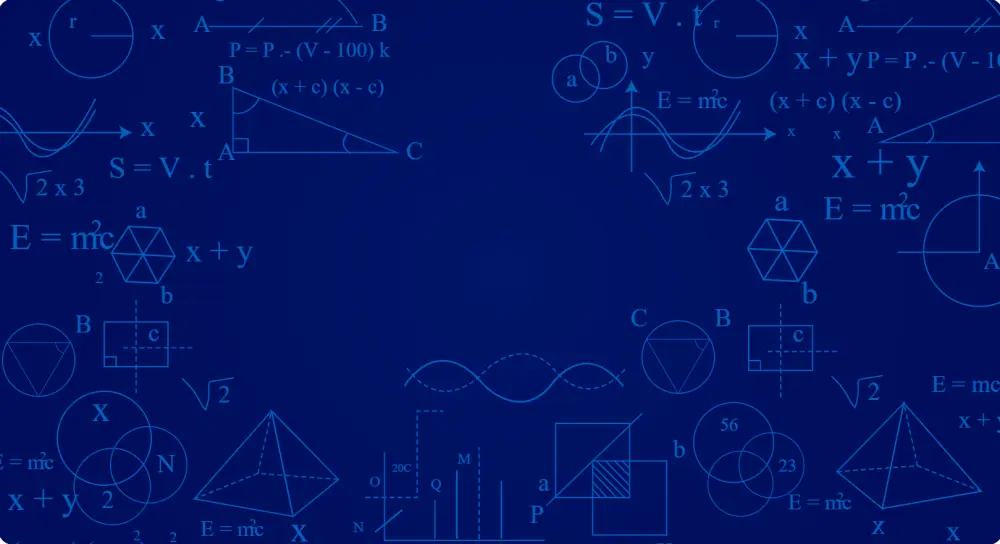
By adding a D value to the trigonometric function, we will translate its graph vertically. If D is positive, the graph will move up by a factor of D, and if D is negative, the graph will move down.
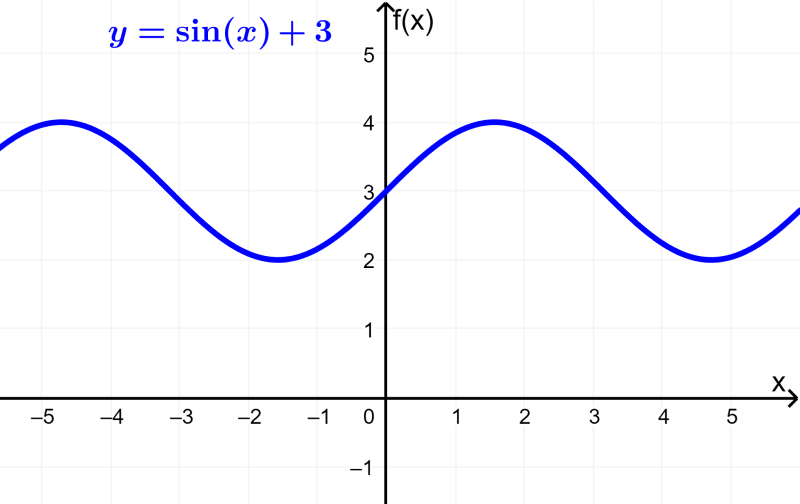
The general form of the sine function with a vertical translation is $latex y = A\sin B(x-C) + D$.
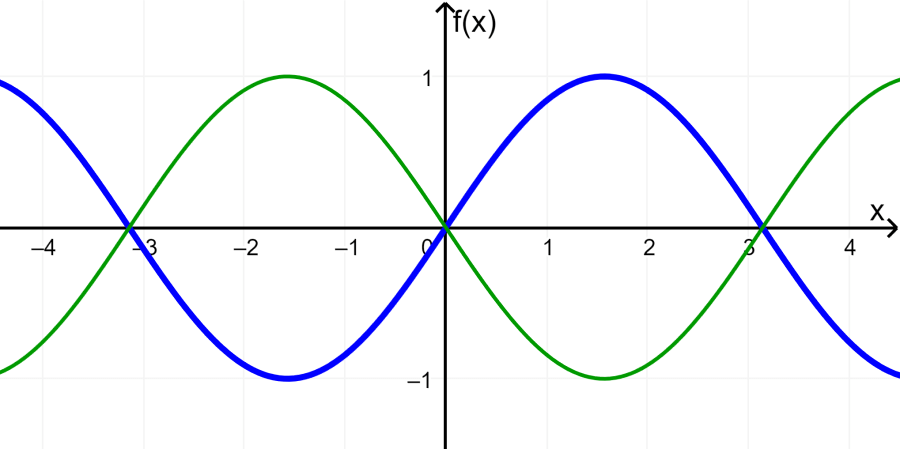
Reflections
To obtain the graph of:
- $latex y=-f(x)$ we reflect the graph of $latex y=f(x)$ with respect to the x axis
- $latex y=f(-x)$ we reflect the graph of $latex y=f(x)$ with respect to the y axis
The following graph shows the sine function in blue, that is, the function $latex y=\sin(x)$. The function in green represents both the function $latex y = -f(x)$ and the function $latex y=f(-x)$. In this particular case, the reflection at x of the function is equal to the reflection at y.
Examples of trigonometric functions with transformations
EXAMPLE 1
- The following is the graph of $latex y=5\sin(2(x-3))+1$.
Here, we have:
- Amplitude: $latex A=5$
- Period: $latex \text{period}=\frac{2\pi}{B}=\frac{2\pi}{2}=\pi$
- Phase: $latex C=3$
- Vertical translation: $latex D=1$
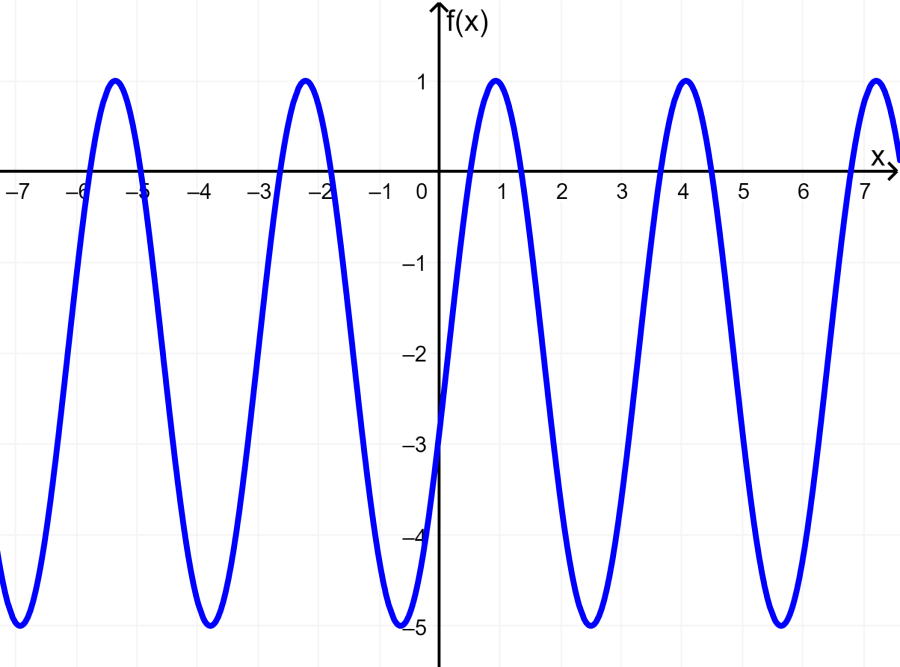
EXAMPLE 2
- The following is the graph of the function $latex y=1.5\sin(0.5(x-2))-1$.
This function has the following:
- Amplitude: $latex A=1.5$
- Period: $latex \text{periodo}=\frac{2\pi}{B}=\frac{2\pi}{0.5}=4\pi$
- Phase: $latex C=2$
- Vertical translation: $latex D=-1$
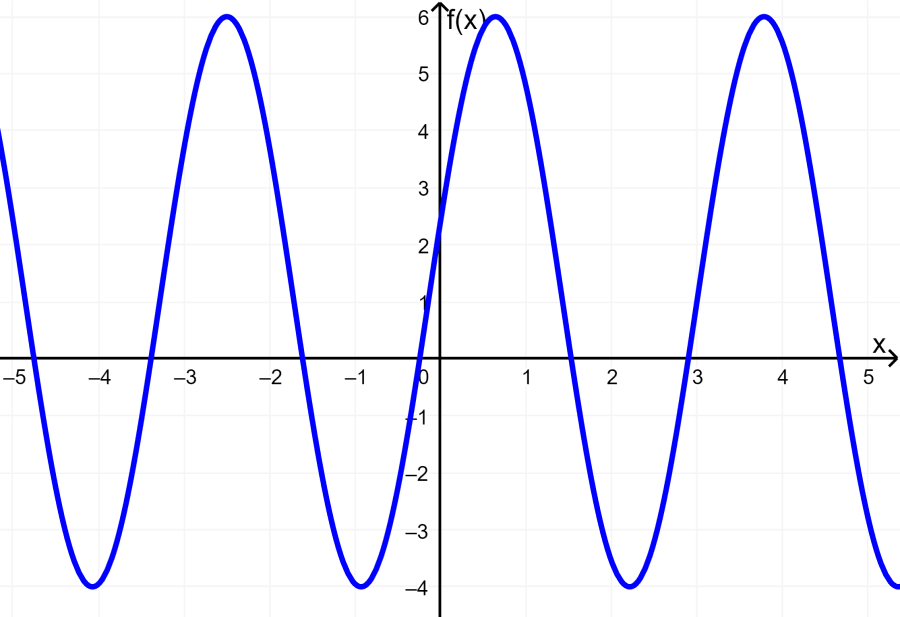
EXAMPLE 3
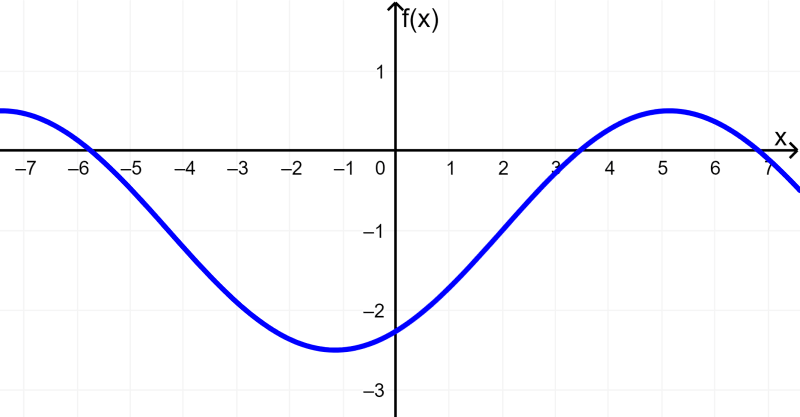
- The following is the graph of the function $latex y=3\sin(2(x+3))-2$.
In this function, we have:
- Amplitude: $latex A=2$
- Period: $latex \text{periodo}=\frac{2\pi}{B}=\frac{2\pi}{2}=\pi$
- Phase: $latex C=-3$
- Vertical translation: $latex D=-2$
See also
Interested in learning more about trigonometric functions? Take a look at these pages:

Jefferson Huera Guzman
Jefferson is the lead author and administrator of Neurochispas.com. The interactive Mathematics and Physics content that I have created has helped many students.