There are several transformations that we can apply to functions to modify their graphs. We can apply a vertical translation or a horizontal translation. In addition, we can also produce reflections with respect to the x-axis and the y-axis. Finally, we can stretch or compress the graphs.
In this article, we will learn about the different transformations used to modify the graphs of functions. We will use several examples to understand the ideas.
ALGEBRA
Relevant for…
Learning about the transformations of graphs of functions.
ALGEBRA
Relevant for…
Learning about the transformations of graphs of functions.
Vertical translation of a function
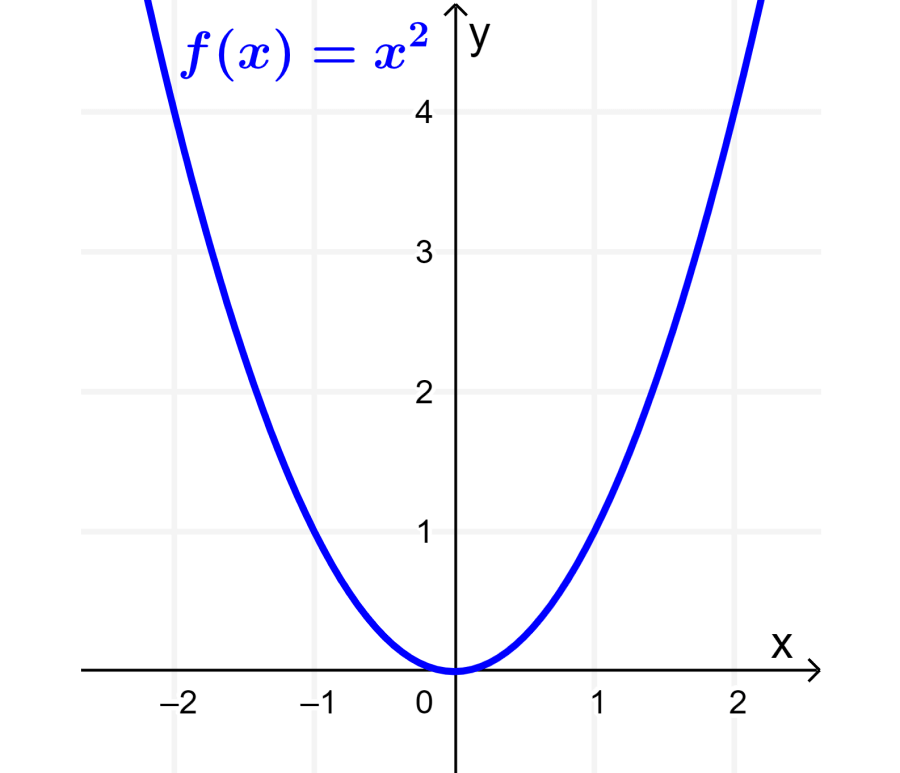
Consider the function f defined by $latex f(x)=x^2$. If we graph this function, we have the following:
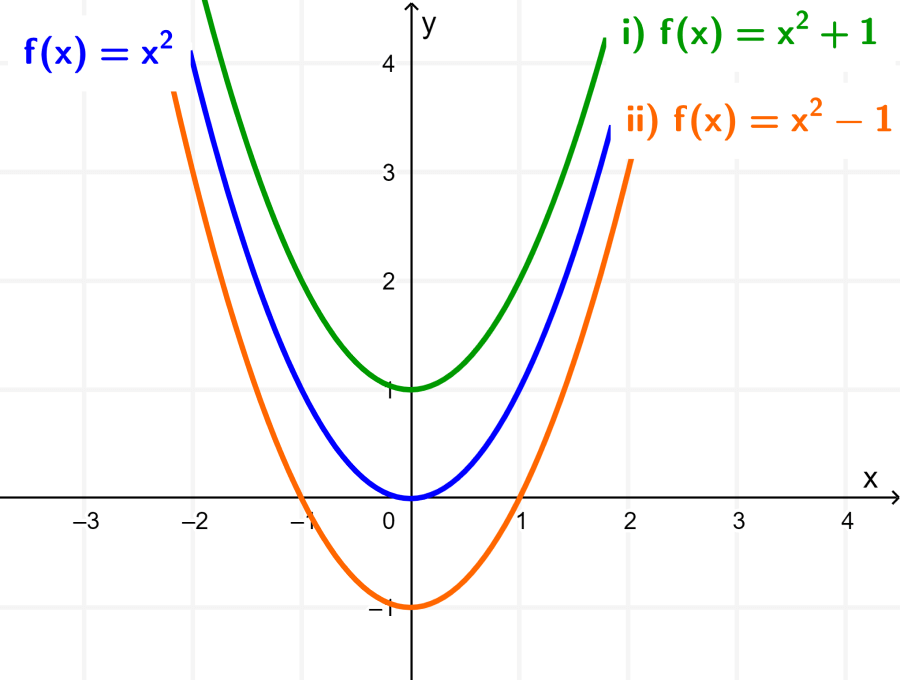
Now if we simplify the expressions for (i) $latex f(x)+1$ and for (ii) $latex f(x)-1$, we have:
(i) $latex f(x)+1=x^2+1~$ and (ii) $latex f(x)-1=x^2-1$
By plotting functions (i) and (ii) on the same coordinate plane as the original function, we obtain the curves shown in the following diagram:
In case (i), the graph of f has been translated 1 unit up. That is, 1 unit parallel to the y-axis.
In case (ii), the graph of f has been translated 1 unit down. That is, -1 unit parallel to the y-axis.
In general, we have the following:
- The transformation $latex f(x)+a$, where $latex a$ is a constant, produces a shift in the graph of f of $latex a$ units parallel to the y-axis (up).
- The transformation $latex f(x)-a$, where $latex a$ is a constant, produces a shift in the graph of f of $latex -a$ units parallel to the y-axis (down).
EXAMPLE
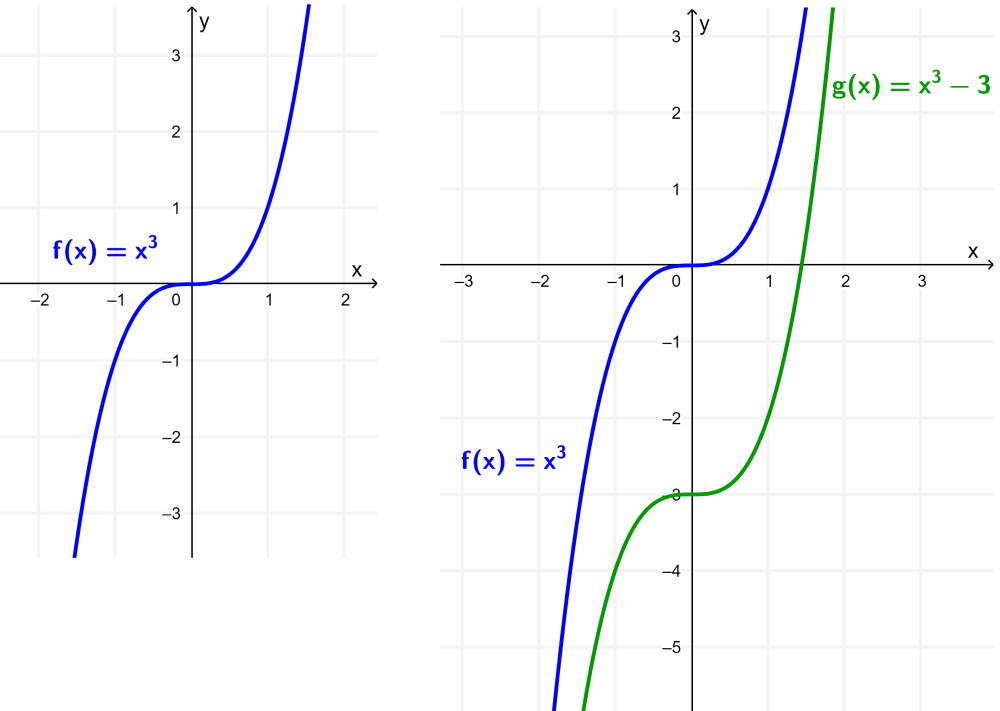
The function f is defined by $latex f(x)=x^3$. Sketch the graph of f and then sketch the graph of $latex g(x)=x^3-3$.
Solution: The graph of f is shown on the left side of the graph below.
Since $latex g(x)=f(x)-3$, we can obtain the graph of the function g by translating the graph of f by -3 units with respect to the y-axis (3 units down). This graph is shown on the right:
Horizontal translation of a function
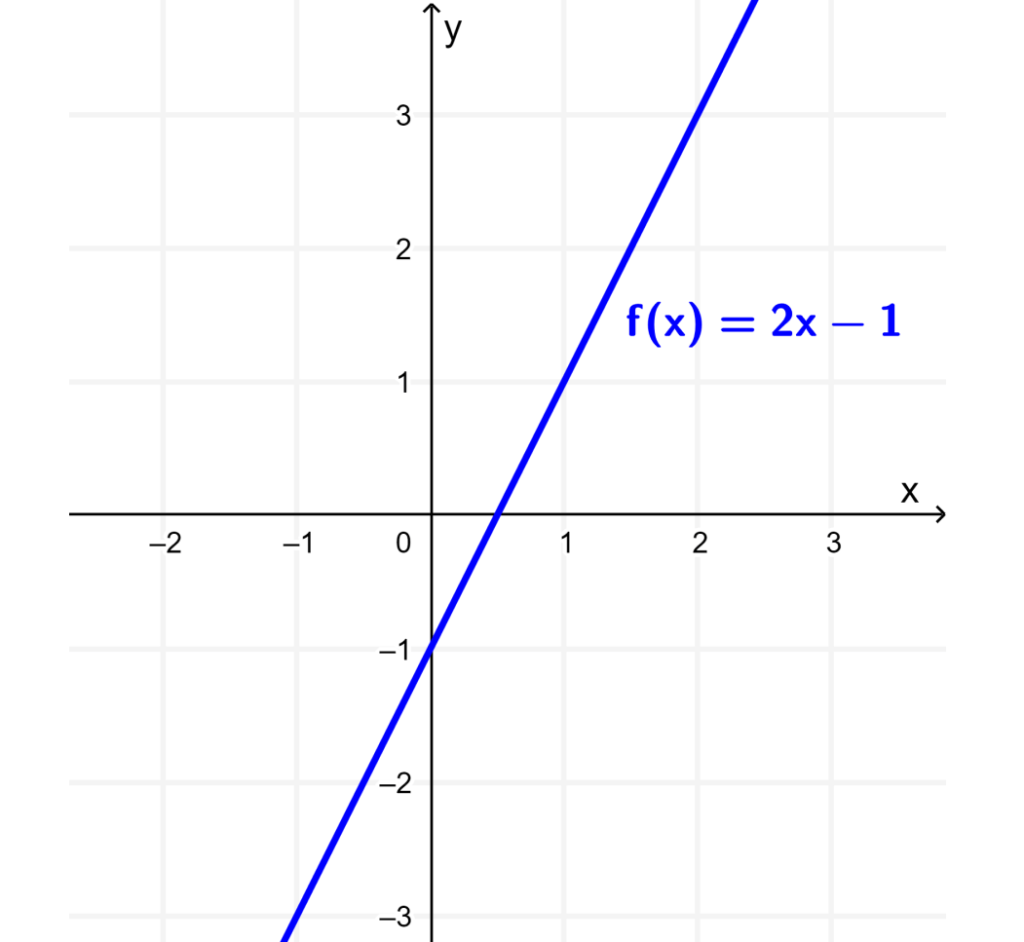
Consider the function f defined by $latex f(x)=2x-1$. By graphing this function, we obtain a line as shown in the following graph:
Now if we simplify the expressions for (i) $latex f(x+2)$ and for (ii) $latex f(x-2)$, we have:
(i) $latex f(x+2)=2(x+2)-1~$ and (ii) $latex f(x-2)=2(x-2)-1$
(i) $latex f(x+2)=2x+3~$ and (ii) $latex f(x-2)=2x-5$
If we graph functions (i) and (ii) on the same Cartesian plane as the original function, we obtain the following straight lines:
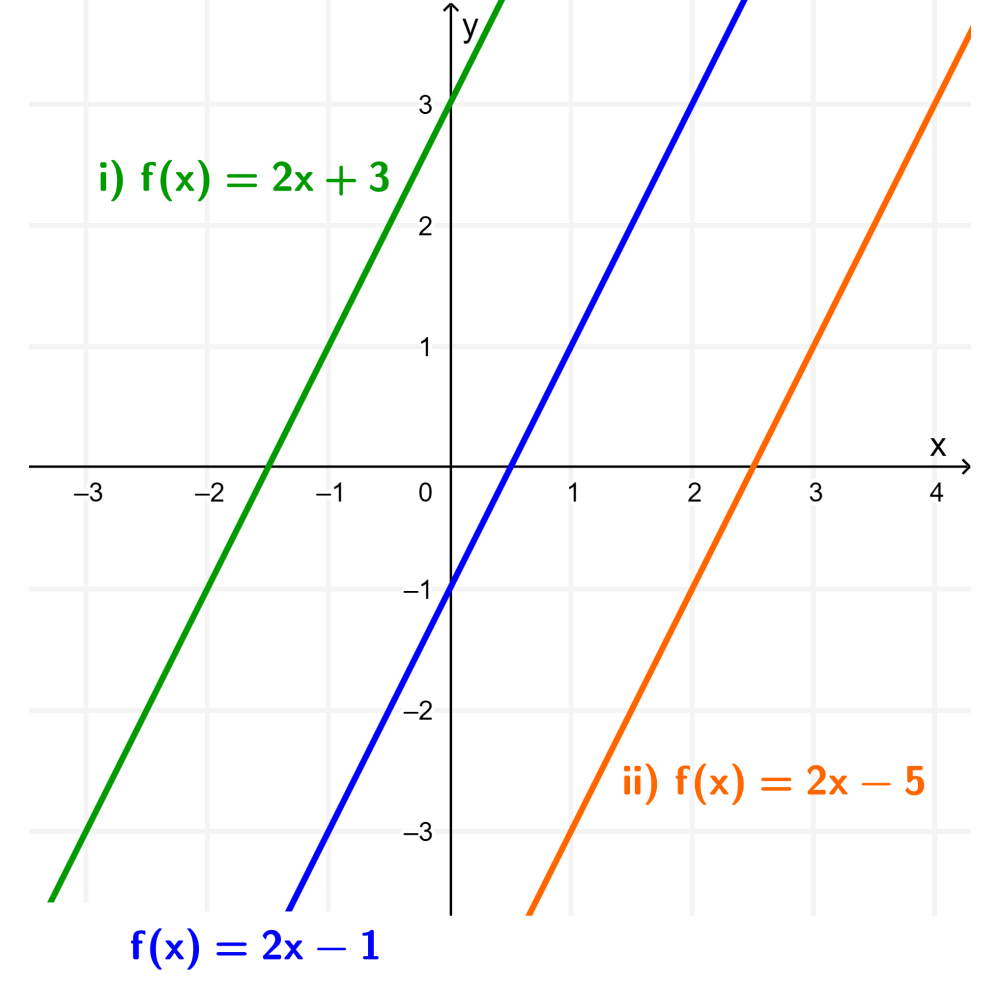
In case (i), the graph of f has been shifted 2 units to the left. That is, -2 units parallel to the x-axis.
In case (ii), the graph of f has been shifted 2 units to the right. That is, 2 units parallel to the x-axis.
In general, we have the following:
- The transformation $latex f(x+a)$, where $latex a$ is a constant, produces a shift in the graph of f of $latex -a$ units parallel to the x-axis (to the left).
- The transformation $latex f(x-a)$, where $latex a$ is a constant, produces a shift in the graph of f of $latex a$ units parallel to the x-axis (to the right).
EXAMPLE
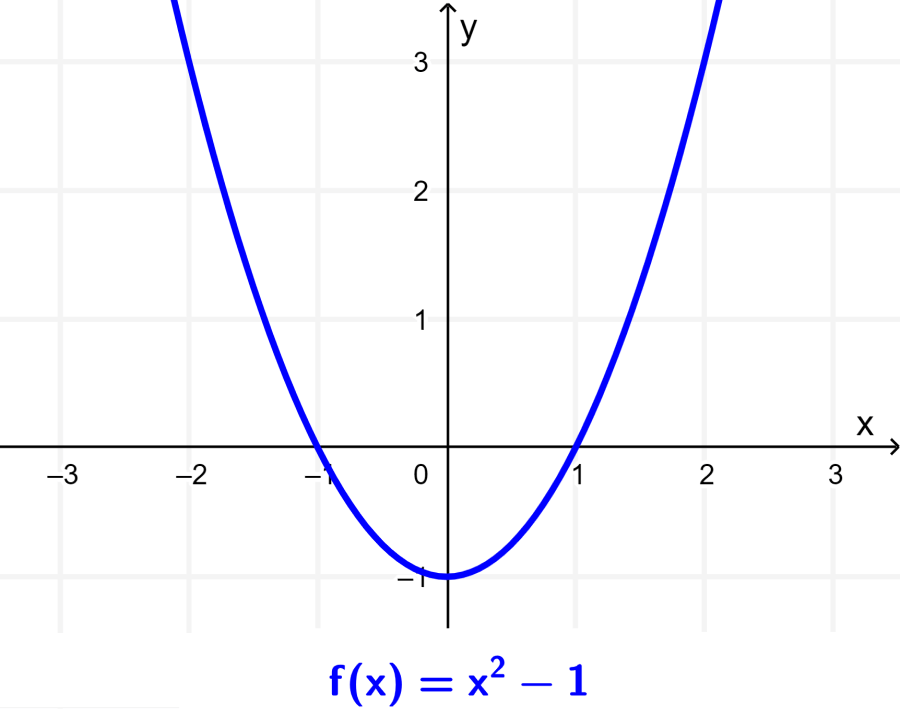
Graph the function $latex f(x)=x^2-1$. Then find the simplified version of $latex g(x)=f(x+2)$ and graph it.
Solution: The graph of the function f is as follows:
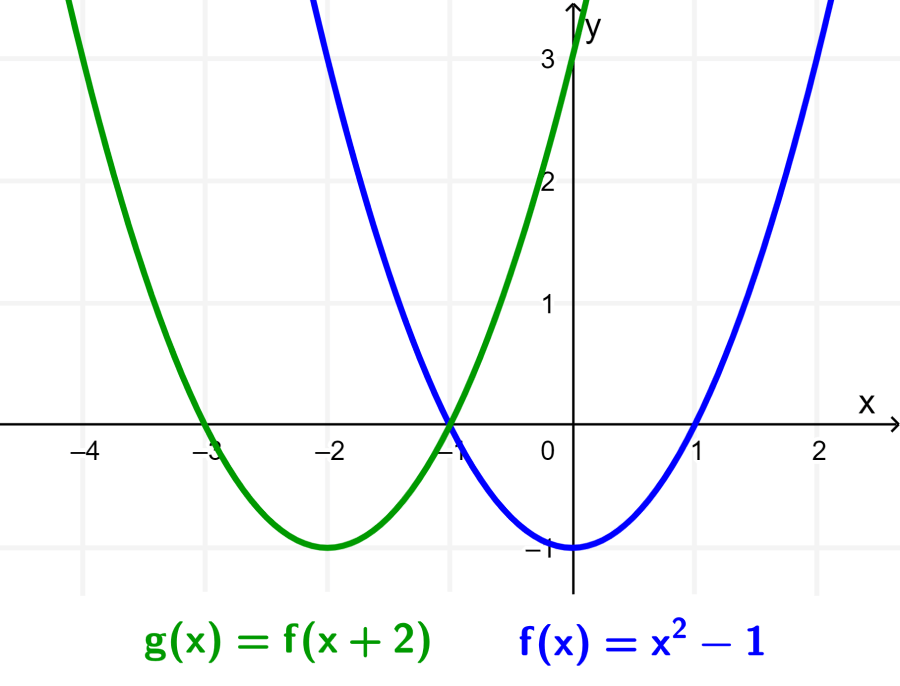
Now, the function g is given by:
$latex g(x)=f(x+2)$
$latex =(x+2)^2-1$
$latex =x^2+4x+4-1$
$latex =x^2+4x+3$
Since $latex g(x)=f(x+2)$, the graph of g can be obtained by translating the graph of f by 2 units to the left, that is, -2 units on the x-axis.
Reflection of functions
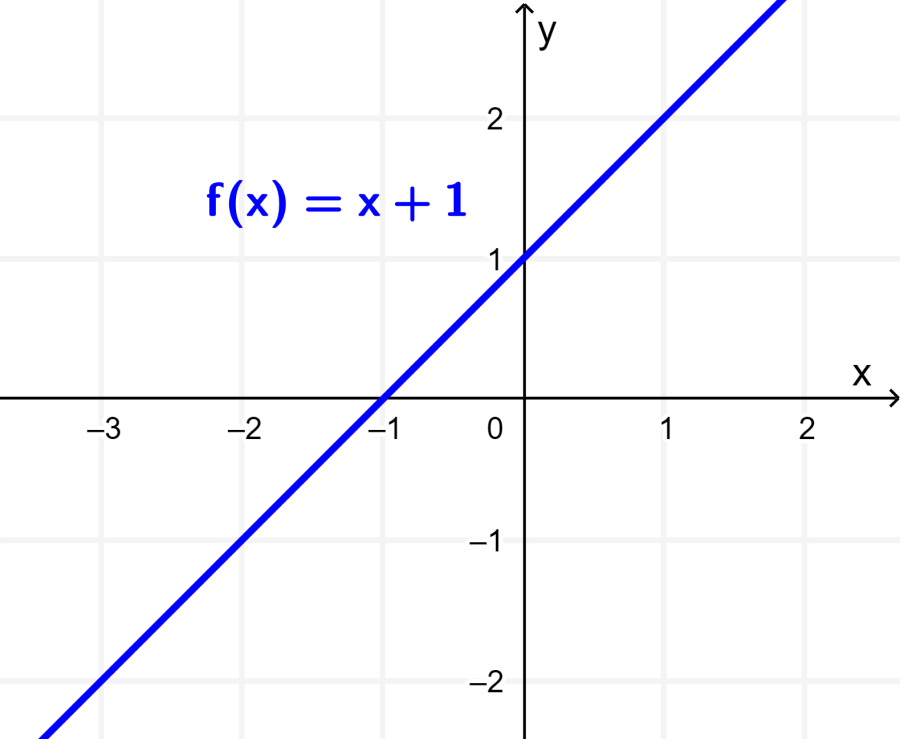
Let’s consider the function f defined by $latex f(x)=x+1$. When we graph this function, we get the line shown in the following graph:
Now, let’s consider the following functions:
(i) $latex -f(x)=-(x+1)=-x-1$
(ii) $latex f(-x)=(-x)+1=-x+1$
By plotting functions (i) and (ii) on the same Cartesian plane as the original function, we obtain the following lines:
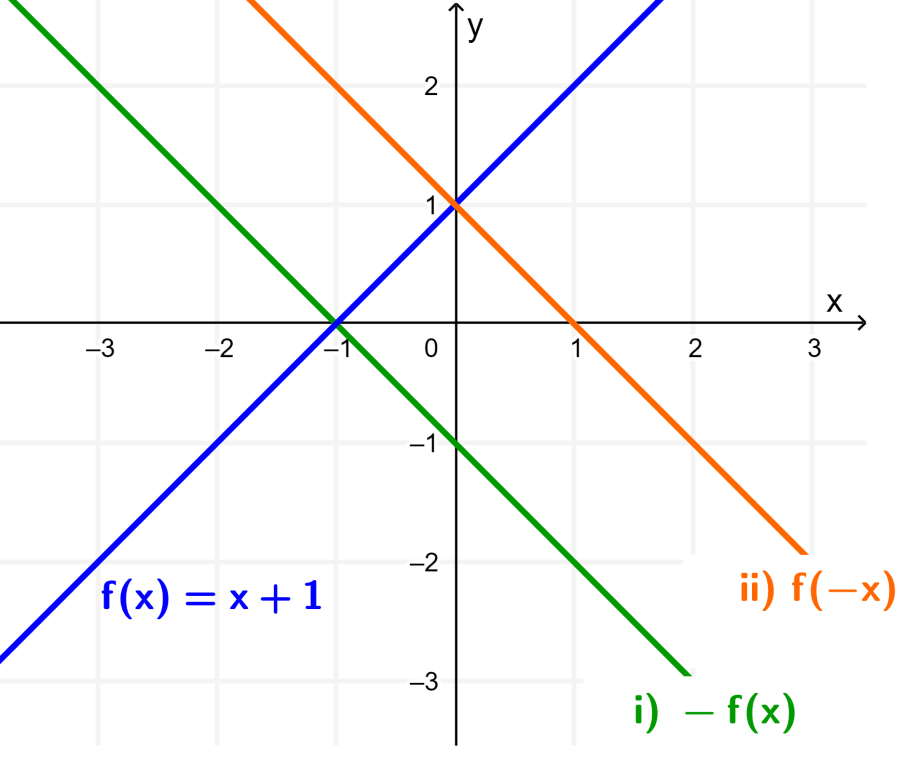
In case (i), the graph of f has been reflected over the x-axis.
In case (ii), the graph of f has been reflected over the y-axis.
In general, we have the following:
- The transformation $latex -f(x)$ produces a reflection of the graph of f with respect to the x-axis.
- The transformation $latex f(-x)$, produces a reflection of the graph of f with respect to the y-axis.
EXAMPLE
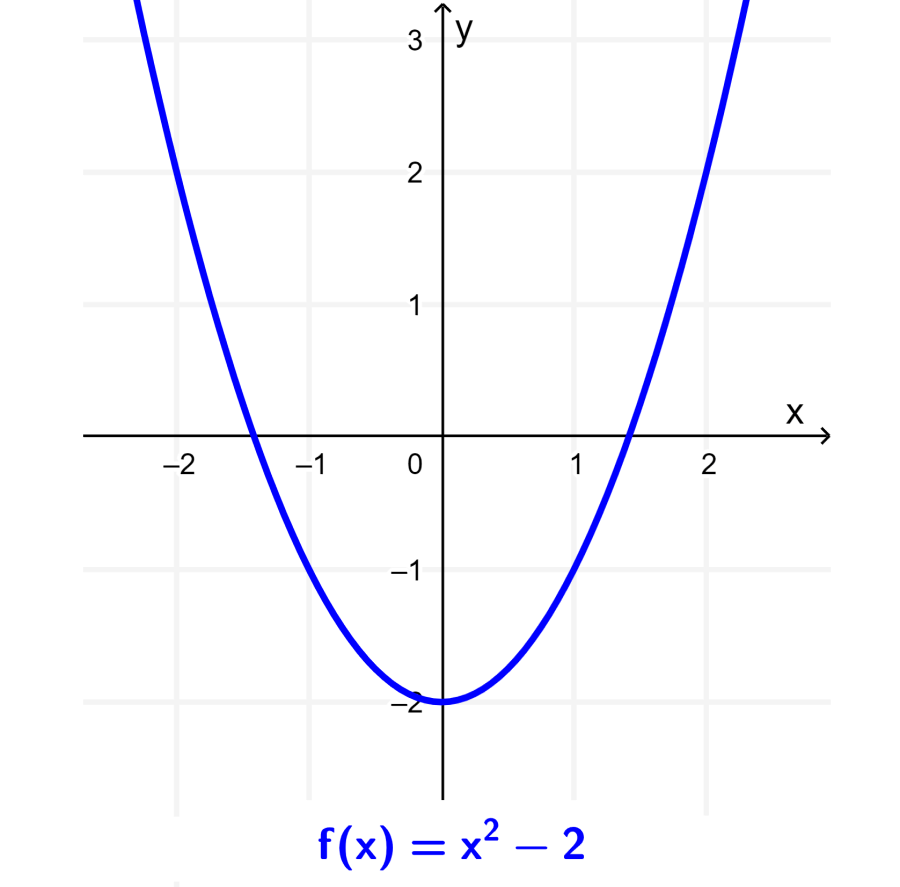
Graph the function $latex f(x)=x^2-2$. Then graph the function $latex g(x)=-f(x)$.
Solution: The graph of the function f is as follows:
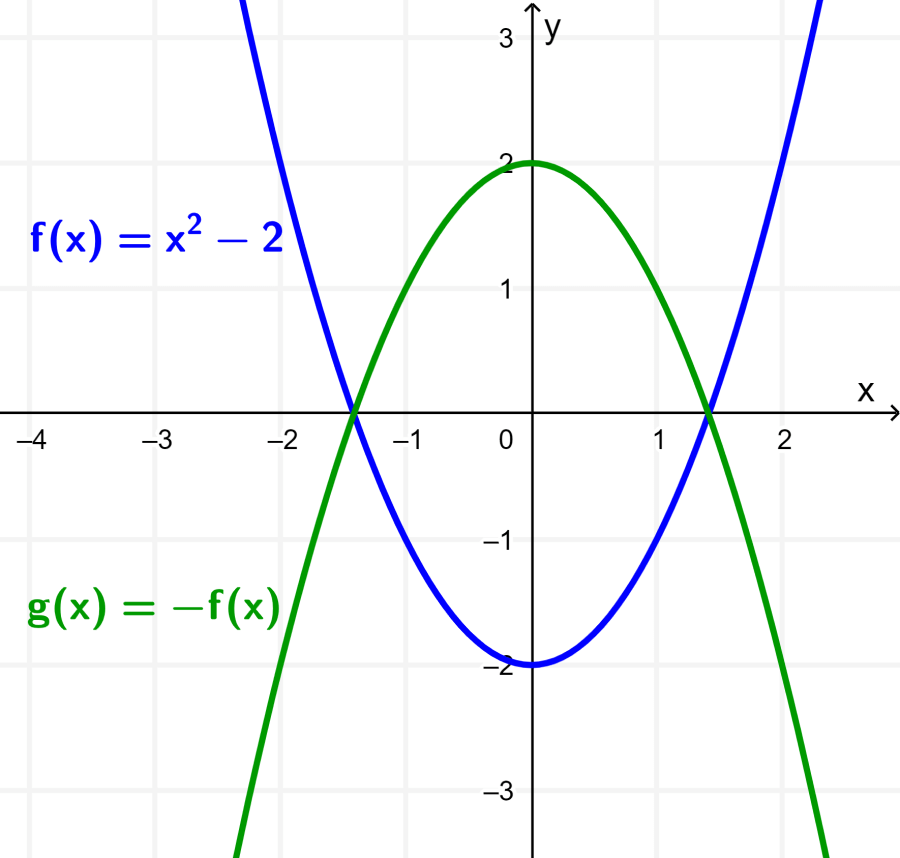
Now, the function g is given by $latex g(x)=-x^2+2$ and its graph can be obtained by reflecting the graph of f over the x-axis:
Stretching of functions
Consider the function f defined by $latex f(x)=x+1$. When we graph this function, we get the line shown in the following graph:
Now, let’s consider the functions (i) $latex f(2x)$ and (ii) $latex 2f(x)$. Then, we have:
(i) $latex f(2x)=(2x)+1~$ and (ii) $latex 2f(x)=2(x+1)$
(i) $latex f(2x)=2x+1~$ and (ii) $latex 2f(x)=2x+2$
By plotting functions (i) and (ii) on the same coordinate plane as the original function, we get the following:
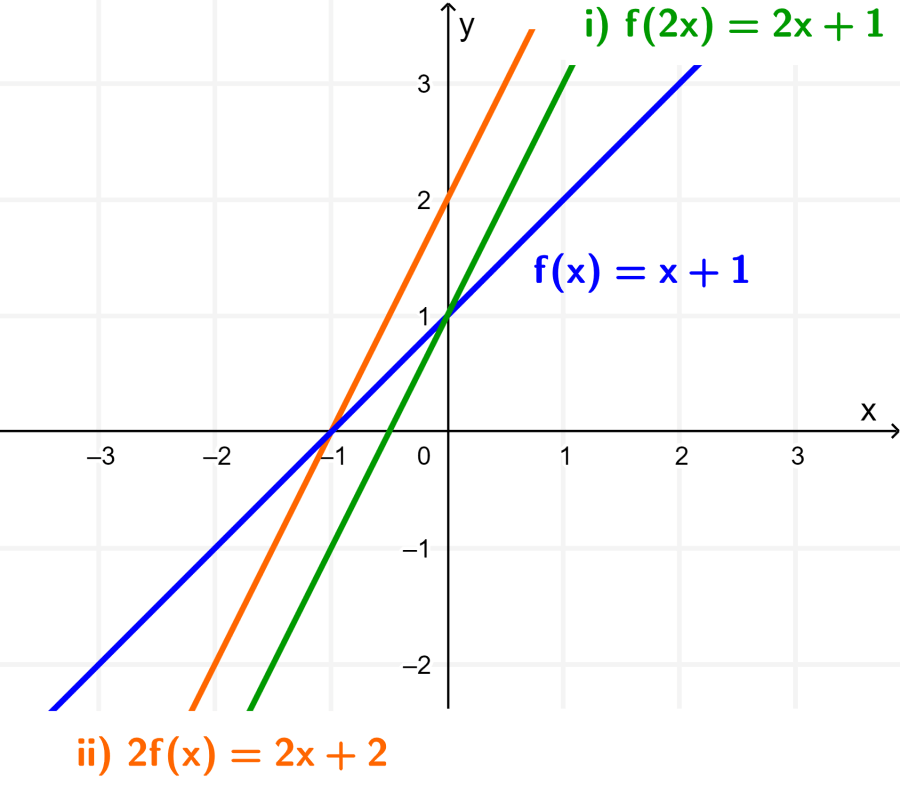
In case (i), the graph of f has been stretched about the x-axis by a factor of $latex \frac{1}{2}$.
In case (ii), the graph of f has been stretched about the y-axis by a factor of 2.
In general, we have the following:
- The transformation $latex f(ax)$, where $latex a$ is a constant, produces a stretch about the x-axis by a factor of $latex \frac{1}{a}$.
- The transformation $latex af(x)$, where $latex a$ is a constant, produces a stretch about the y-axis by a factor of $latex a$.
EXAMPLE
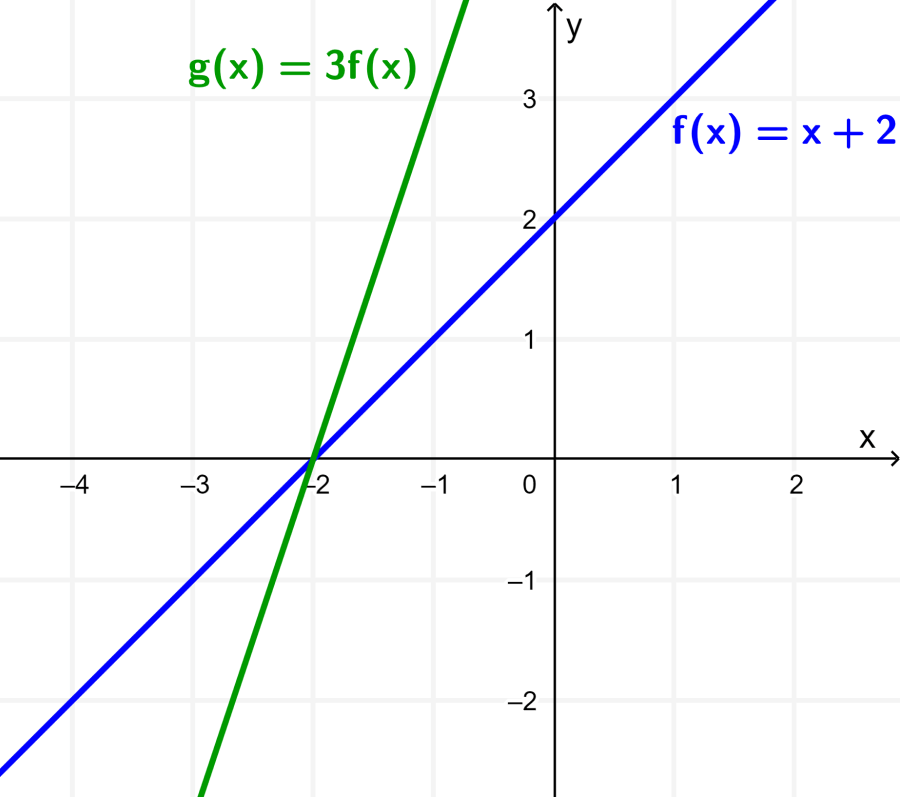
Graph the function $latex f(x)=x+2$. Then graph the function $latex g(x)=3f(x)$.
Solution: The graph of function f is as follows:
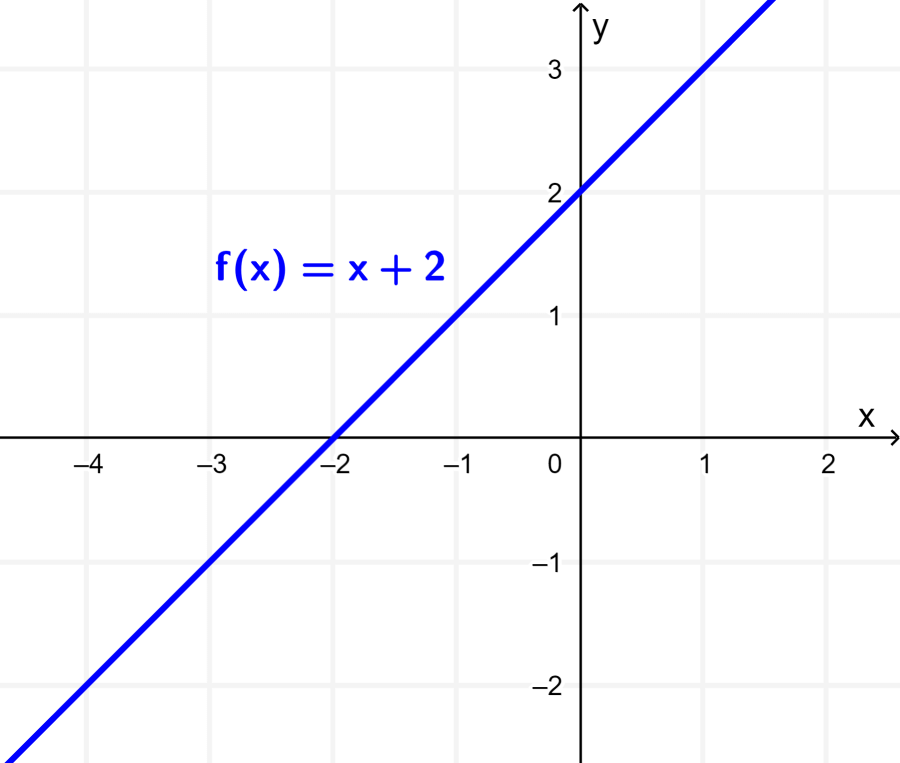
When we simplify, we can see that the function g is given by $latex g(x)=3x+6$. We can get the graph of this function by stretching the function of f by a factor of 3 about the y-axis.
See also
Interested in learning more about function transformations? Take a look at these pages:

Jefferson Huera Guzman
Jefferson is the lead author and administrator of Neurochispas.com. The interactive Mathematics and Physics content that I have created has helped many students.