The graph of the sine function is characterized by being a function that has a period of 2π. This means that the function repeats itself every 2π and extends indefinitely in both the positive and negative directions. Therefore, the domain of the function is equal to all real numbers since the values of x can take any value.
However, the range of a basic sine function is from -1 to 1, so the values of y go from -1 to 1. We can obtain more variations of the graph of the sine if we change its different parameters, such as amplitude, phase, period, and its vertical displacement.
TRIGONOMETRY
Relevant for…
Learning about the graph of the sine function with examples.
TRIGONOMETRY
Relevant for…
Learning about the graph of the sine function with examples.
Graph of the basic sine function
On the graph of the sine function, we place the angles on the x-axis and we place the result of the sine of each angle on the y-axis. The graph of the sine is a curve that varies from -1 to 1 and repeats every 2π. These types of curves are called sinusoidal.
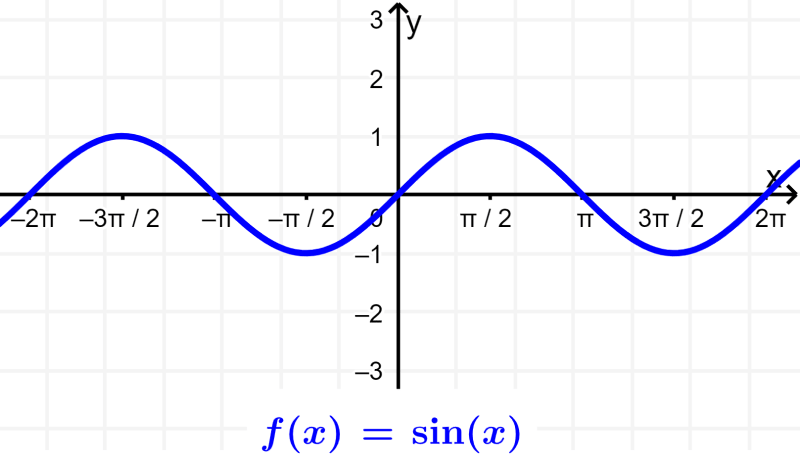
Clearly, we can see that the function repeats at regular intervals of 2π. Furthermore, we also observe that the graph is symmetric with respect to the origin, that is, 180° symmetric. This means that the sine function is an odd function.
Domain of the sine function
The sine function extends indefinitely to both the positive x side and the negative x side. This function repeats indefinitely with a period of 2π or 360°, so we can use any angle as input. Therefore, the domain of the sine function is equal to all real numbers.
Range of the sine function
The graph of the basic sine function shows us that the values of y go from -1 to 1. The function always returns values within this range and never goes out. This means that the range of the sine function is all real numbers between 1 and -1.
Graphs of variations of the cosine function
We can obtain variations of the basic sine function by modifying several parameters in the general form of the sine. The general form of the sine function is:
$latex y=A~\sin(Bx-C)+D$
By modifying the parameters of this function, we can obtain different variations of the sine graph. Each parameter affects different characteristics of the graph.
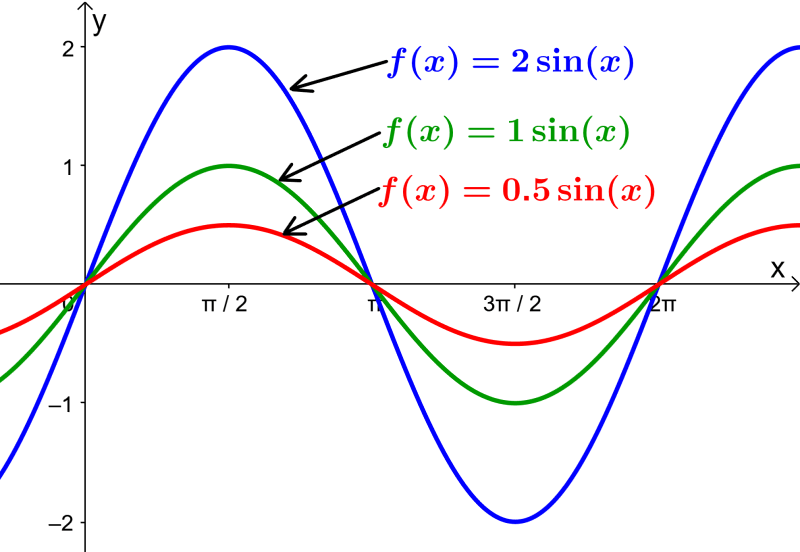
Changing the amplitude of the sine function
The amplitude of the sine function represents the distance from the middle line of the graph to the highest or lowest point. Amplitude is measured in absolute value. We can also consider the amplitude as a measure of the height of the graph. The basic sine function has an amplitude of 1 and its midline is located on the x-axis.
Using the general shape of the sine, its amplitude is found using |A|. For example, the amplitude of $latex y = 4 \sin(x)$ is 4.
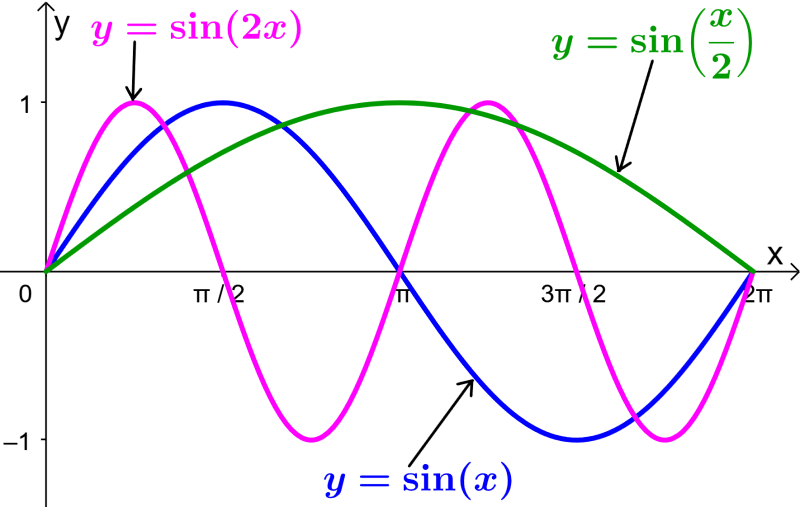
Changing the period of the sine function
The period of the sine function is the interval after which the function repeats itself. The period of the basic sine function is 2π.
The period is affected by the parameter B in the general form. To find the period in this form we use the equation $latex P = \frac {2 \pi} {|B|}$. When we have $latex B> 1$, the function “moves” faster and the period is less than 2π.
This results in the function being horizontally compressed. When we have $latex B<1$, the function “moves” more slowly and the period is greater than 2π. This results in the function being stretched horizontally.
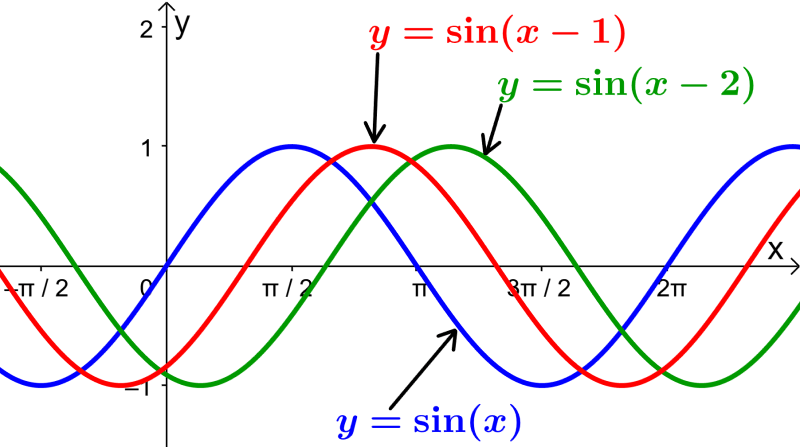
Changing the phase of the sine function
The phase of the sine function is the horizontal shift of the function with respect to the basic sine function.
We can find the phase by rewriting the general form of the function as follows: $latex y = A ~ \sin(B (x- \frac{C}{B}) + D$. Using this form, the phase is equal to $latex \frac{C}{B}$. When we have $latex C>0$, the graph has a shift to the right. When we have $latex C<0$, the graph has a shift to the left.
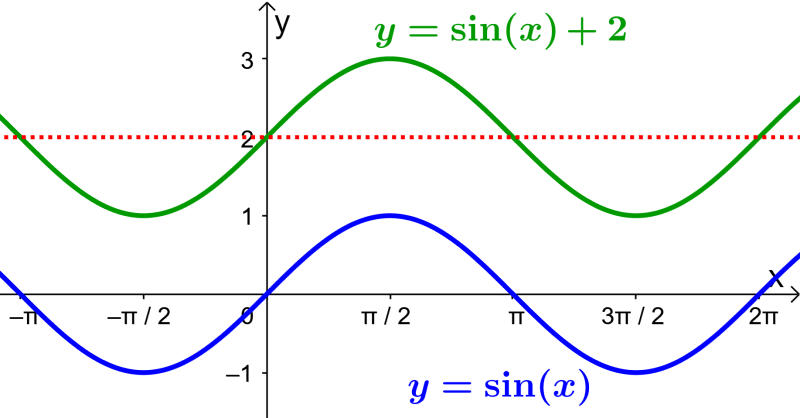
Changing the vertical translation of the sine function
The vertical translation or displacement corresponds to the value of D in the general form of the sine function. The value of D is the vertical displacement of the middle line of the graph.
When D is positive, the graph is shifted up. When D is negative, the graph is shifted down. For example, the function $latex y = \sin(x)+D$ has its median line at $latex y=D$.
Examples with answers of the graph of sine
What you have learned about sine graphs is applied to solve the following practice exercises. Try to solve the exercises yourself before looking at the answer.
EXAMPLE 1
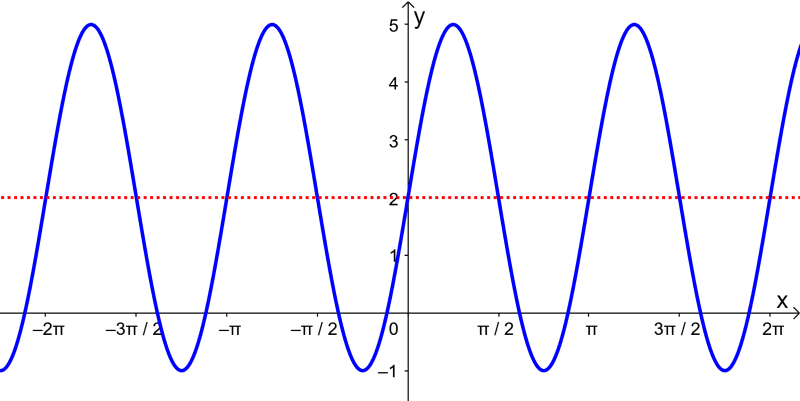
If we have the function $latex y = 3 \sin(2x) +2$, what is its graph?
Solution
We have to find the characteristics that the function will have using its different parameters. Comparing this function with the general shape of the sine, we see that we have:
- Amplitude: $latex |A|=3$. The graph will be three times as high.
- Period: $latex P=\frac{2\pi}{|B|}=\frac{2\pi}{2}=\pi$. The period is halved, so the graph will be horizontally compressed.
- Phase: $latex \frac{C}{B}=0$. The function has no phase.
- Vertical translation: $latex D=2$. We have the middle line in $latex y=2$.
Therefore, we determine that the graph of the function is:
EXAMPLE 2
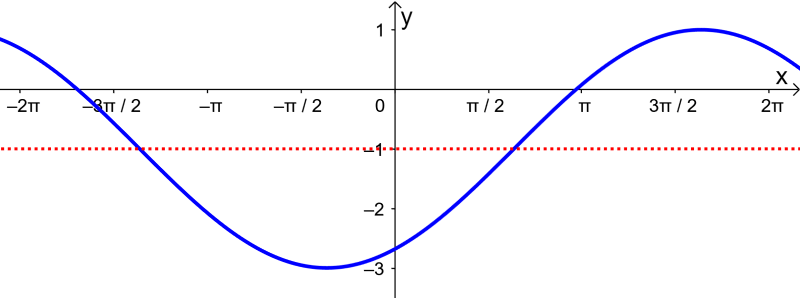
What is the graph of the function $latex y = 2 \sin(\frac{1}{2} x-1) -1$?
Solution
We compare the function in its general form with the given function to extract the following information:
- Amplitude: $latex |A|=2$. The graph will be twice as high.
- Period: $latex P=\frac{2\pi}{|B|}=\frac{2\pi}{\frac{1}{2}}=4\pi$. The period is twice the period of the basic function, so the graph will be stretched horizontally.
- Phase: $latex \frac{C}{B}=\frac{1}{\frac{1}{2}}=2$. The graph is shifted 2 units to the right.
- Vertical translation: $latex D=-1$. The midline is at $latex y=-1$.
Applying these transformations to the basic sine function, we have:
EXAMPLE 3
What is the equation of the following sine function?
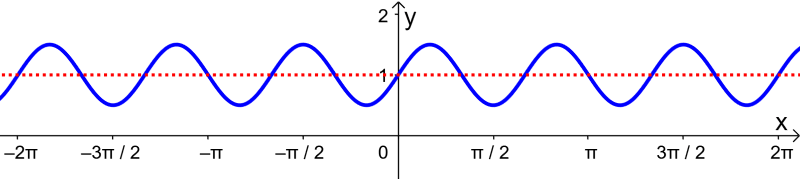
Solution
By looking at the graph, we can obtain the following information:
- The distance from the midline to the highest point is 0.5. This means that $latex A=\frac{1}{2}$.
- The graph has a period of $latex \frac{2 \pi}{3}$. Therefore, we have that the B parameter must be 3.
- The graph has no horizontal offset, so C must be 0.
- The middle line is located at $latex y = 1$, so D equals 1.
With this information, we conclude that the equation of this function is:
$latex y=\frac{1}{2}\sin(3x)+1$
EXAMPLE 4
What is the equation of the following sine function?
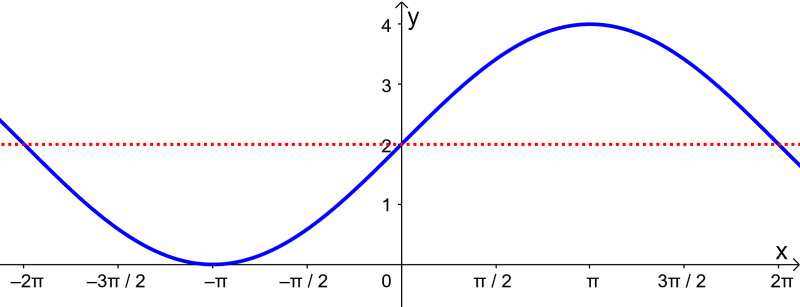
Solution
We extract the following information from the graph of the function:
- The height is twice the basic sine function, so $latex A = 2$.
- The period of the function is 4π, so we have $latex B =\frac{1}{2}$.
- We don’t have any horizontal displacement, so C must be 0.
- The middle line is located at $latex y=2$, so D equals 2.
Using this information, we conclude that the equation of the graph is:
$latex y=2\sin(\frac{1}{2}x)+2$
See also
Interested in learning more about sine of an angle? Take a look at these pages:

Jefferson Huera Guzman
Jefferson is the lead author and administrator of Neurochispas.com. The interactive Mathematics and Physics content that I have created has helped many students.