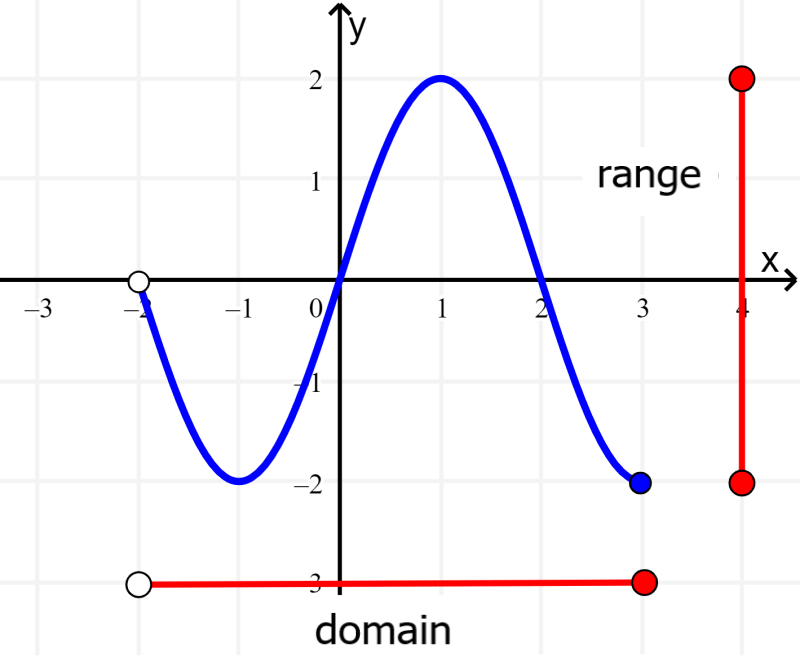
The range of a function can be found by graphing the function and identifying all values of y that are possible with the domain of the function. In some functions, such as linear functions, cubic functions, or the tangent function, the range of the function is equal to all real numbers.
Here, we will learn how to find the range of a function using its graph. We will look at some examples to illustrate the process used.
Method to find the range of a function
To find the range of a function, it is always helpful to sketch a simple graph of the function. For example, suppose we have the function $latex f(x)=2x$, which is defined for all real values of x. Then, the following is its graph:
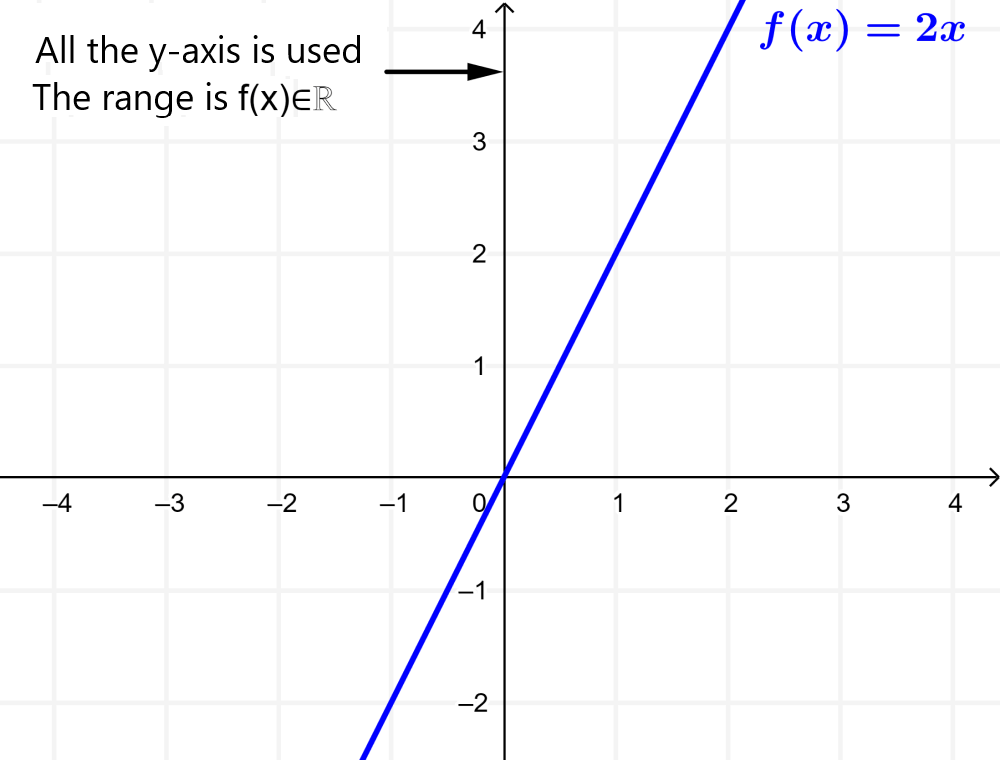
The range of the function $latex f(x)$ is the set of all output values of the function. That is, the range is the part of the y-axis that is used by the function. In this function, the range is the set of all real numbers.
To indicate that the range is all real numbers, we can write
{$latex f(x):f(x)\in \mathbb{R}$}
or simply, we can write $latex f(x) \in \mathbb{R}$.
When a function is defined by a restricted domain, the range of the function may also be restricted. For example, consider the following function and its graph:
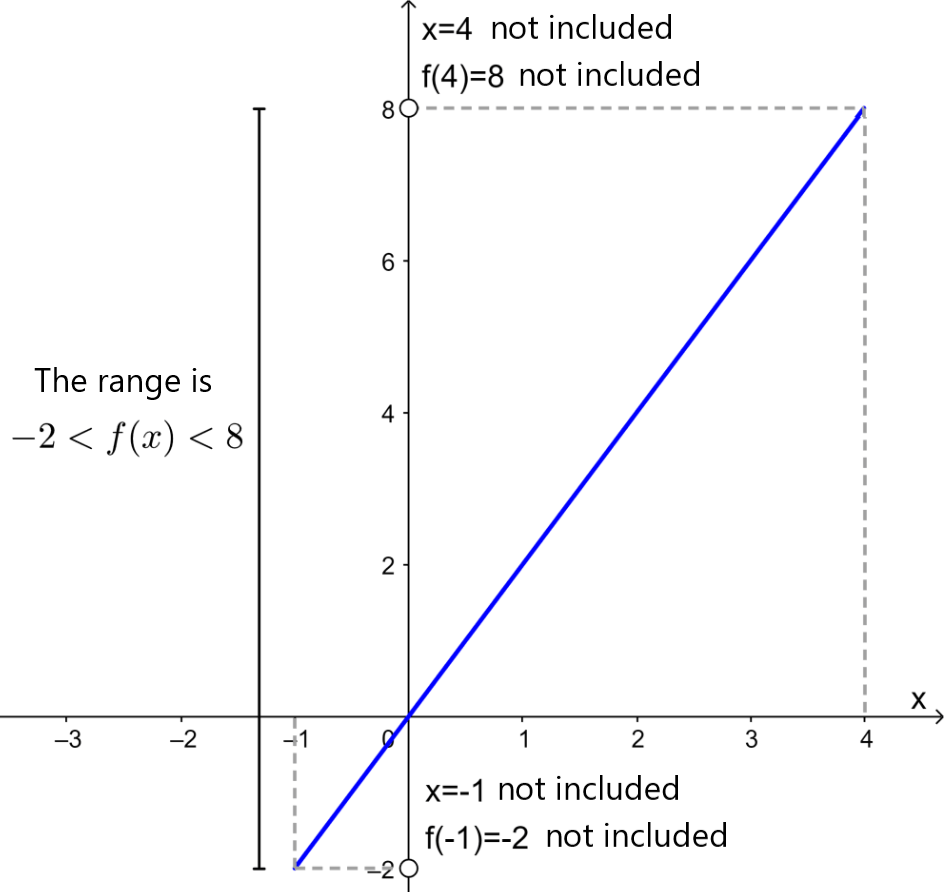
$latex f(x)=2x$, $latex ~~-1<x<4$
The range of the function is the set of real numbers from -2 to 8, excluding -2 and 8, since -1 and 4 are excluded from the domain of the function. We write this range as
$latex -2<f(x)<8$
Examples of the range of functions
In the following examples, we can apply what we have learned about the range of a function. Each of the examples has a detailed solution using the graph of the function.
EXAMPLE 1
Find the range of the function $latex f(x)={{x}^2}+2$.
Solution: The function $latex f(x)={{x}^2}+2$ is defined for all real values of x since there are no restrictions on the value of x. Its graph is as follows:
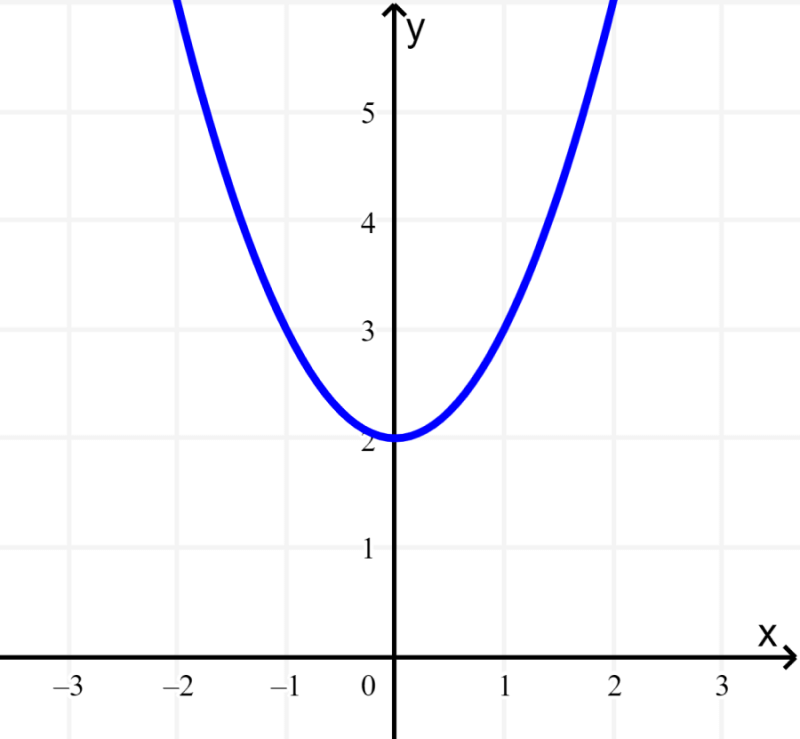
Since $latex {{x}^2}$ is never negative, $latex {{x}^2}+2$ is never less than 2. Therefore, the range of $latex f(x)$ is:
“All real numbers $latex f(x) \geq 2$”
The graph clearly indicates that the values of f(x) are never less than 2.
EXAMPLE 2
Find the range of the function $latex f(t)=\sqrt{5-t}$.
Solution: This is a square root function. Its graph is as follows:
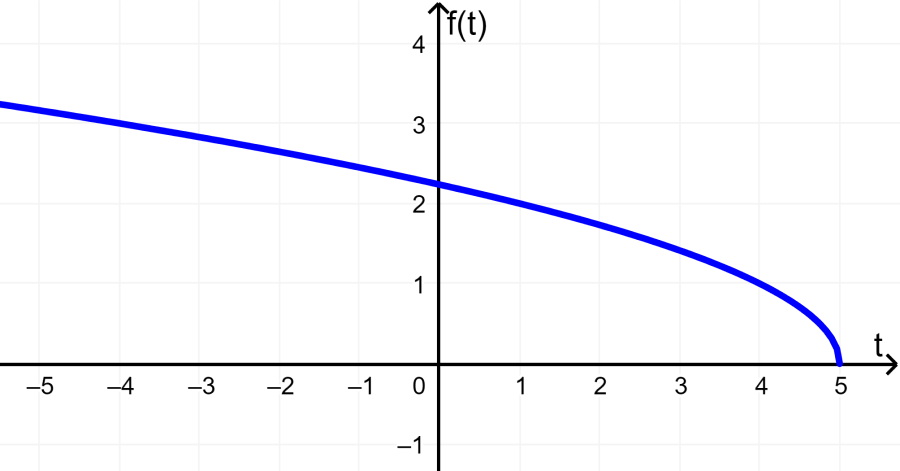
We can see that the function $latex f(t)$ does not result in negative values. Therefore, its range is:
“All real numbers, $latex f(t)\geq 0$”
The range is all real numbers greater than or equal to 0.
EXAMPLE 3
What is the range of the function $latex f(x)=2x-1$, for $latex x\geq 0$.
Solution: In this case, the function $latex f(x)$ has the values of x restricted to numbers equal to or greater than 0. Therefore, we have the following graph:
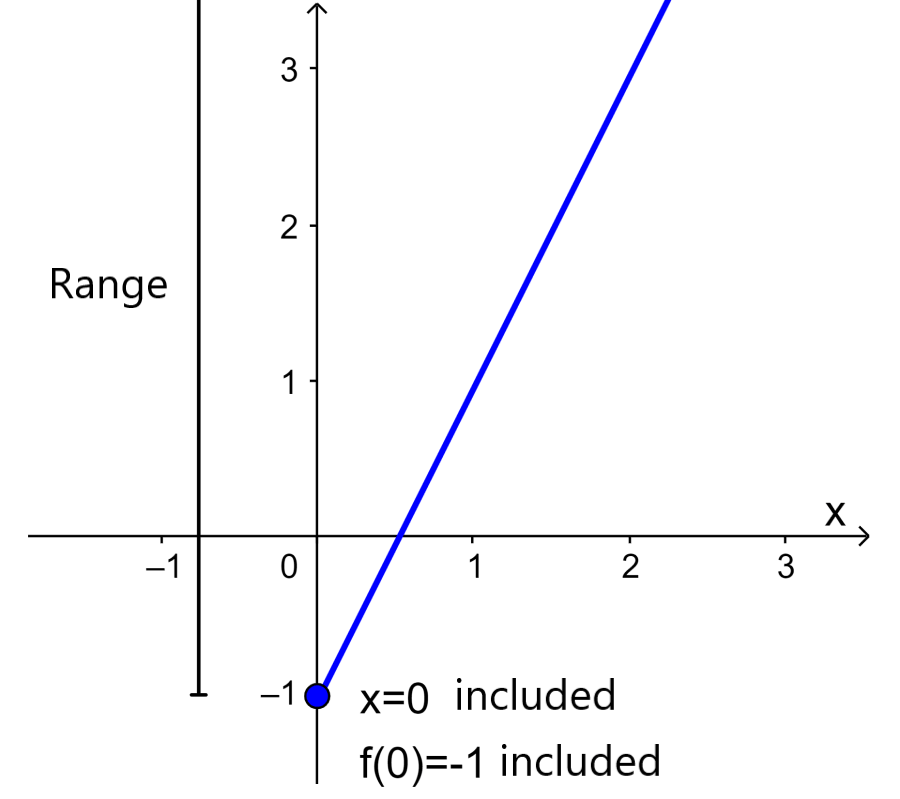
From the graph, we can see that when $latex x\geq 0$, we have $latex f(x)\geq -1$. Therefore, the range of the function is:
“All real numbers, $latex f(x)\geq -1$”
EXAMPLE 4
Find the range of the function $latex f(x)= \frac{1}{x+3}$.
Solution: This is a rational function that has the following graph:
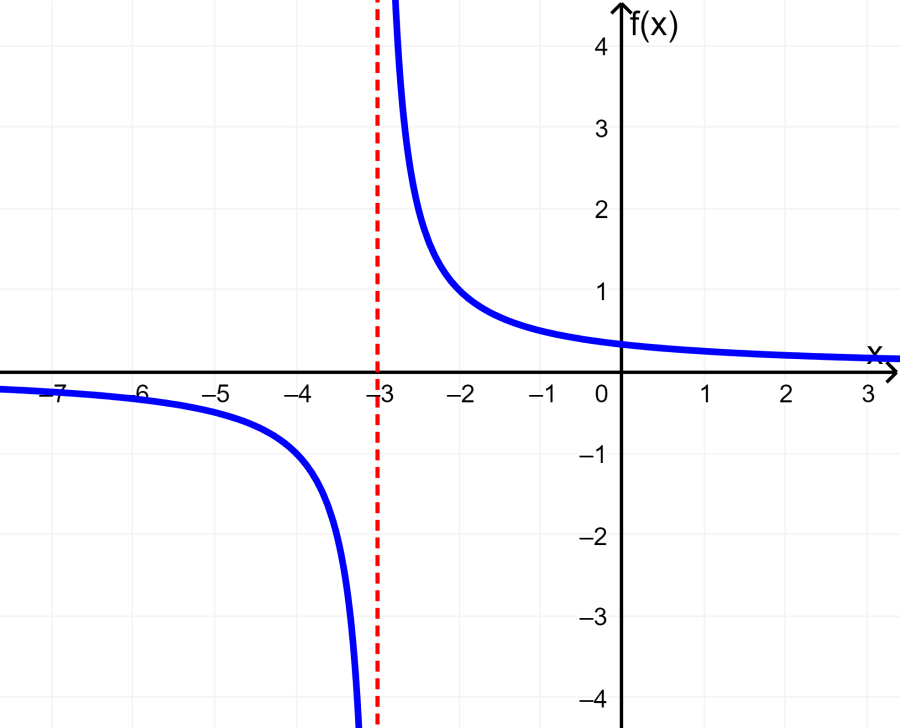
The function $latex f(x)= \frac{1}{x+3}$ is not defined for $latex x=-3$ because this would result in division by zero (we would have a 0 in the denominator).
From the graph, we can see that the values of $latex f(x)$ can be any value except zero. If we try to solve the equation for y=0, we have:
$latex 0= \frac{1}{x+3}$
Multiplying both sides by $latex x+3$, we have:
$latex 0= 1$
This is impossible. Therefore, the range of $latex f(x)$ is:
“All real numbers except zero”
See also
Interested in learning more about algebraic functions? Take a look at these pages:

