Rational functions are functions that have a fraction with a polynomial in the denominator and a polynomial in the numerator. To graph these functions, it is necessary to determine what their asymptotes are.
Here, we will look at a summary of rational functions. We will review how to graph rational functions and how to find asymptotes. In addition, we will look at several examples of rational functions with answers to fully understand the process used to find asymptotes and graph these types of functions.
Summary of rational functions
A rational function is a function that can be written as a fraction of two polynomial functions. Neither the coefficients of the polynomials nor the values taken by the function have to necessarily be rational numbers.
A function of a variable x is considered a rational function only if it can be written in the form:
$latex f(x)=\frac{P(x)}{Q(x)}$
where, P and Q are polynomial functions and $latex Q(x)$ is nonzero.
Graphing rational functions
To graph rational functions, we follow the following steps:
Step 1: Find the intercepts if they exist. The y-intercept is the point $latex (0, ~f(0))$ and we find the x-intercepts by setting the numerator as an equation equal to zero and solving for x.
Step 2: We find the vertical asymptotes by setting the denominator equal to zero and solving.
Step 3: If it exists, we find the horizontal asymptote using the details below about the asymptotes.
Step 4: The vertical asymptotes will divide the graph into several regions. We have to find several points in each of the regions to determine the general shape that the graph will have.
Step 5: We draw the graph that passes through all the points found.
Finding asymptotes
If we have the rational function $latex \frac{a{{x}^n}+\cdots}{b{{x}^m}+\cdots}$, where, n means the largest exponent of the numerator and m means the largest exponent denominator, We can find asymptotes in the following way:
1. If the denominator is zero at $latex x=a$ and the denominator is not zero at $latex x=a$, the graph will have a vertical asymptote at $latex x=a$.
2. If $latex n<m$, the x-axis is the horizontal asymptote.
3. If $latex n=m$, the line $latex y=\frac{a}{b}$ is the horizontal asymptote.
4. If $latex n>m$, there will be no horizontal asymptotes
Examples with answers of rational function problems
The following rational functions exercises are solved using the process detailed above. Try to solve the exercises yourself before looking at the answer.
EXAMPLE 1
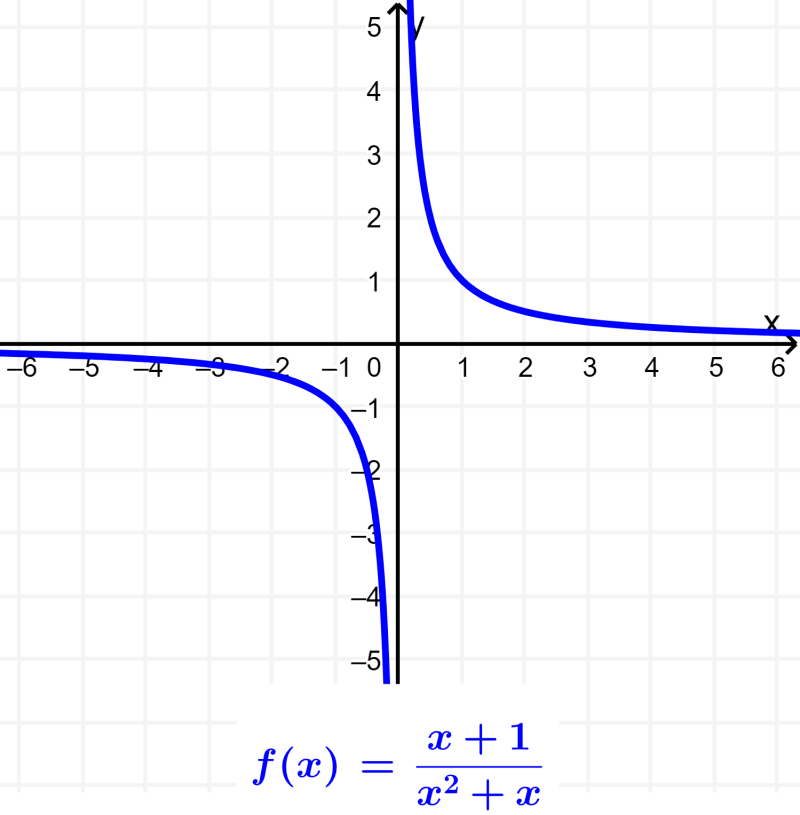
Obtain the graph of the rational function $latex f(x)= \frac{-3}{x-1}$.
Solution
Step 1: We start by finding the intercepts of the function:
- The y-intercept is the point $latex (0,~ f(0))=(0, 3)$.
- For x-intercepts, we set the numerator equal to zero and solve. However, here the numerator is the constant -3, so it has no zeros. Therefore, the function has no x-intercepts.
Step 2: To find the vertical asymptotes, we make the denominator equal to zero and solve:
$latex x-1=0$
$latex x=1$
We have a vertical asymptote at $latex x=1$.
Step 3: The largest exponent of x in the denominator is 1, which is larger than the exponent of x in the numerator (0). Thus, the x-axis is the horizontal asymptote.
Step 4: We only have one vertical asymptote, so we have two regions on the graph: $latex x>1$ and $latex x<1$.
We need a point in each region to determine whether it will be located above or below the horizontal asymptote. Therefore, we can use:
$latex f(0)=3$ ⇒ $latex (0, ~3)$
$latex f(2)=-3$ ⇒ $latex (2, ~-3)$
Step 5: The following is the graph of the function:
EXAMPLE 2
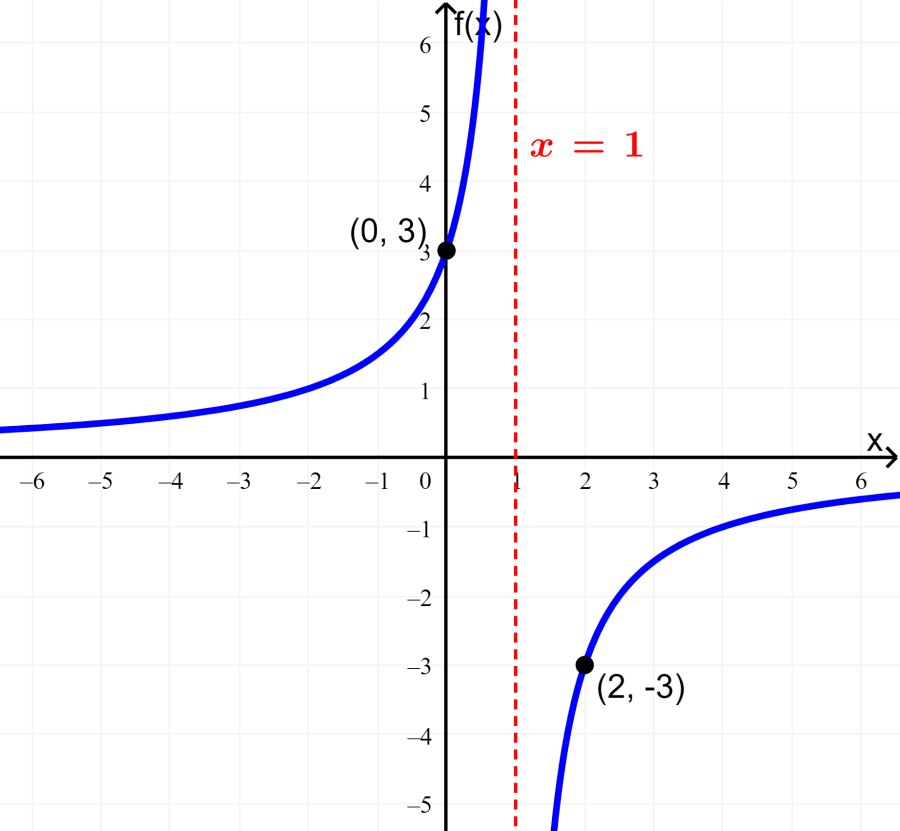
Graph the rational function $latex f(x)=\frac{4-2x}{1-x}$.
Solution
Step 1: We have to find the intercepts of the function:
- The y-intercept is the point $latex (0, ~f(0))=(0, ~4)$.
- We find the x-intercepts by setting the numerator equal to zero and solving:
$latex 4-2x=0$
$latex -2x=-4$
$latex x= 2$
The x-intercept is $latex x=2$.
Step 2: We find the vertical asymptotes by making the denominator equal to zero and solving:
$latex 1-x=0$
$latex x=1$
We have a vertical asymptote at $latex x=1$.
Step 3: The largest exponents of x in both the denominator and the numerator are equal. Thus, the horizontal asymptote is equal to the coefficient of x in the numerator divided by the coefficient of x in the denominator:
$latex y=\frac{-2}{-1}=2$
Step 4: We have a vertical asymptote, so we only have two regions on the graph: $latex x>1$ and $latex x<1$.
We have to find a point in each region to know if it will be located above or below the horizontal asymptote. Therefore, we are going to use:
$latex f(0)=4$ ⇒ $latex (0, ~4)$
$latex f(2)=0$ ⇒ $latex (2, ~0)$
Step 5: With the points obtained, we graph the function:
EXAMPLE 3
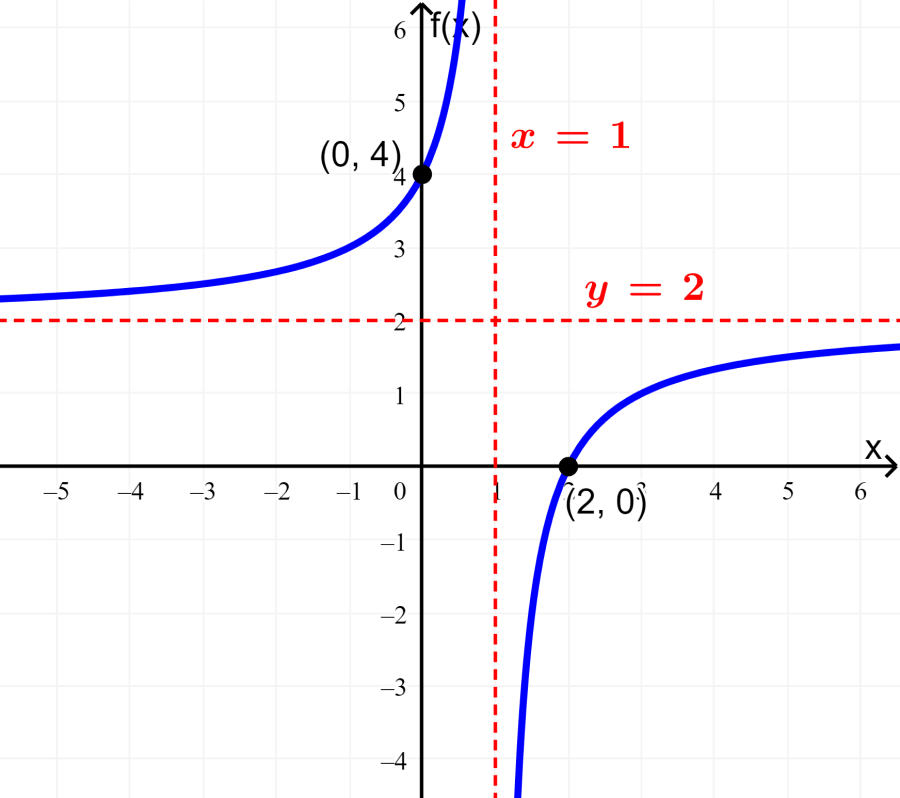
Graph the rational function $latex f(x)=\frac{4}{{{x}^2}+x-2}$.
Solution
Step 1: We have to find the intercepts of the function:
- The y-intercept is the point $latex (0, ~f(0))=(0, ~-2)$.
- We find the x-intercepts by setting the numerator equal to zero and solving. In this case, the numerator is the constant 4, so we have no zeros and the function has no x-intercepts.
Step 2: We set the denominator equal to zero and solve to find the vertical asymptotes:
$latex {{x}^2}+x-2=0$
$latex (x+2)(x-1)=0$
We have the vertical asymptotes $latex x=1$ and $latex x=-2$.
Step 3: In this function, the largest exponent of x in the denominator is greater than the exponent of x in the numerator (0). Thus, the x-axis is the horizontal asymptote.
Step 4: We have two vertical asymptotes, so we have three regions on the graph: $latex x<-2$, $latex -2<x<1$ and $latex x>1$.
We need a point in each region to determine whether it will be located above or below the horizontal asymptote. The middle region is a bit more complicated, so we will need a couple of points close to the vertical asymptotes. Therefore, we can use:
$latex f(-3)=1$ ⇒ $latex (-3, ~1)$
$latex f(-1)=-2$ ⇒ $latex (-1, ~-2)$
$latex f(0)=-2$ ⇒ $latex (0, ~-2)$
$latex f(2)=1$ ⇒ $latex (2, ~1)$
Step 5: The following is the graph of the function:
EXAMPLE 4
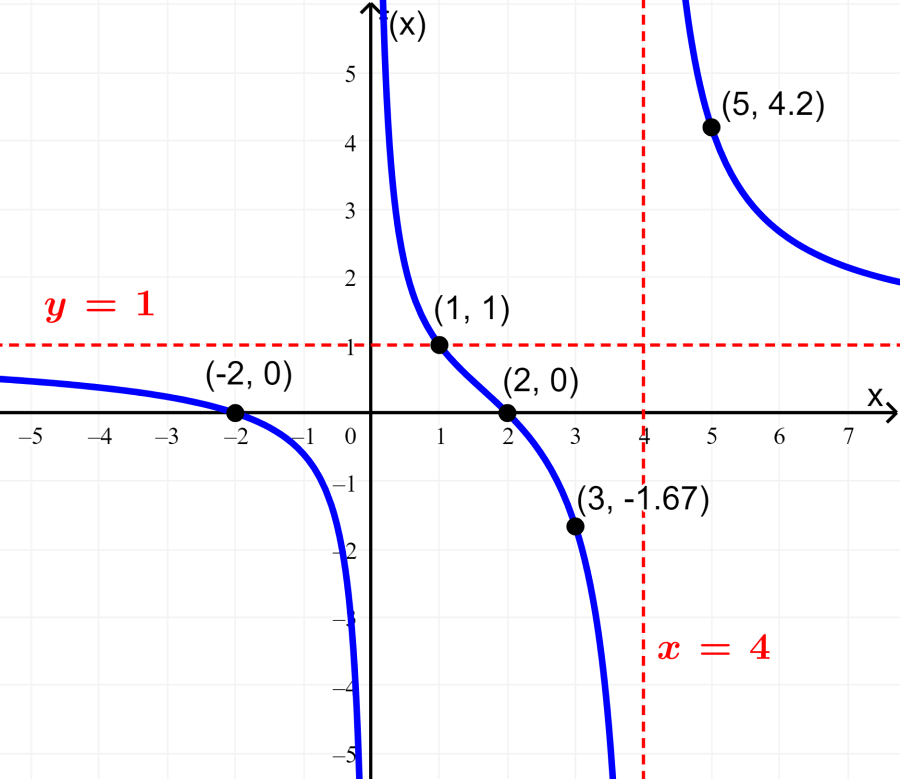
Find the graph of the rational function $latex f(x)=\frac{{{x}^2}-4}{{{x}^2}-4x}$.
Solution
Step 1: The intercepts of the rational function are:
- If we use $latex x=0$, we will obtain division by zero, so the function does not have a y-intercept. However, we have already found a vertical asymptote.
- The x-intercepts are:
$latex {{x}^2}-4=0$
$latex x=\pm 2$
Therefore, we have two x-intercepts.
Step 2: We already found a vertical asymptote but there could be more. Therefore, we make the denominator zero and solve:
$latex {{x}^2}-4x=x(x-4)=0$
$latex x=0$ and $latex x=4$
We obtained two vertical asymptotes at $latex x=0$ and $latex x=4$.
Step 3: The largest exponent of x in the numerator is 2, similar to the numerator. Thus, we will have a horizontal asymptote in:
$latex y=\frac{1}{1}=1$
Step 4: We have the regions: $latex x<0$, $latex 0<x<4$ and $latex x>4$.
One of the x-intercepts is in the left region, so we don’t need a point there. The other x-intercept is in the middle region, but we need more points to determine its behavior. Also, we need a point in the right region. Therefore, we have:
$latex f(1)=1$ ⇒ $latex (1,~1)$
$latex f(3)=-\frac{5}{3}$ ⇒ $latex (3, ~-\frac{5}{3})$
$latex f(5)=\frac{21}{5}$ ⇒ $latex (5, ~\frac{21}{5})$
Step 5: The following is the graph of the function:
EXAMPLE 5
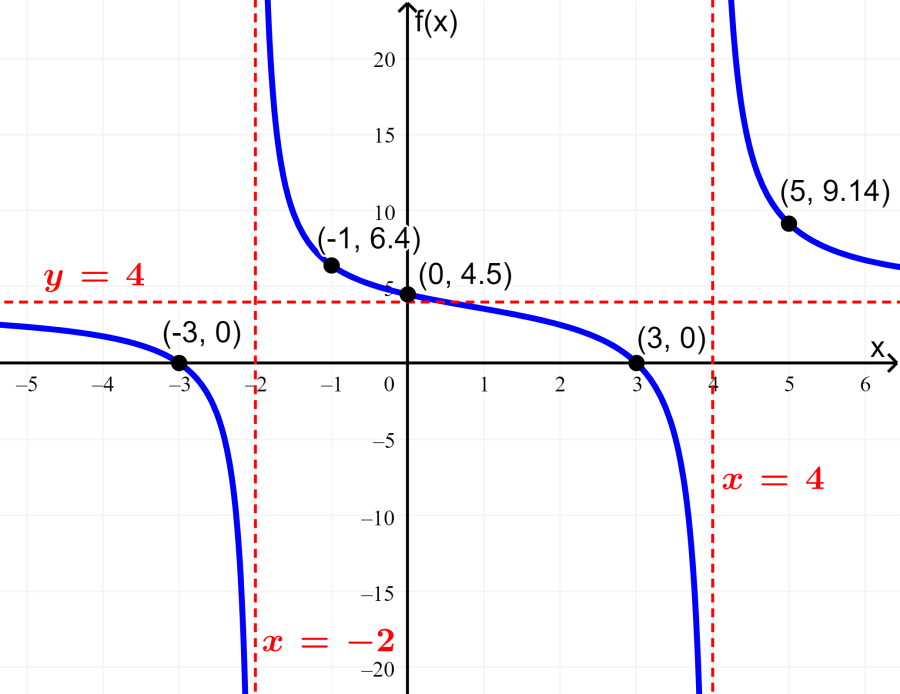
Graph the function $$f(x)= \frac{4{{x}^2}-36}{{{x}^2}-2x-8}$$
Solution
Step 1: We start with the intercepts of the function:
- The y-intercept is the point $latex (0, f(0))=(0, \frac{9}{2})$.
- The x-intercepts are:
$latex 4{{x}^2}-36=0$
$latex 4{{x}^2}=36$
$latex {{x}^2}=9$
$latex x= \pm3$
The x-intercepts are (-3, 0) and (3, 0).
Step 2: To find the vertical asymptotes, we make the denominator equal to zero and solve:
$latex {{x}^2}-2x-8=0$
$latex (x+2)(x-4)=0$
We have two vertical asymptotes in $latex x=-2$ and $latex x=4$.
Step 3: The largest exponent of x in both the denominator and the numerator is 2. Therefore, the horizontal asymptote is:
$latex y= \frac{4}{1}=4$
Step 4: We have two vertical asymptotes, so we have the regions: $latex x<-2$, $latex -2<x<4$ y $latex x>4$.
We need a point in each region, but we need a couple of points in the middle region. Therefore, we can use:
$latex f(-3)=0$ ⇒ $latex (-3, 0)$
$latex f(-1)= \frac{32}{5}$ ⇒ $latex (-1, \frac{32}{5})$
$latex f(3)=0$ ⇒ $latex (3, 0)$
$latex f(5)=\frac{64}{7}$ ⇒ $latex (5, \frac{64}{7})$
Step 5: The following is the graph of the function:
See also
Interested in learning more about rational functions? Take a look at these pages:

Jefferson Huera Guzman
Jefferson is the lead author and administrator of Neurochispas.com. The interactive Mathematics and Physics content that I have created has helped many students.